
Hello,
I suspect some memory leak in my application. ( turning app into OOM very fast )
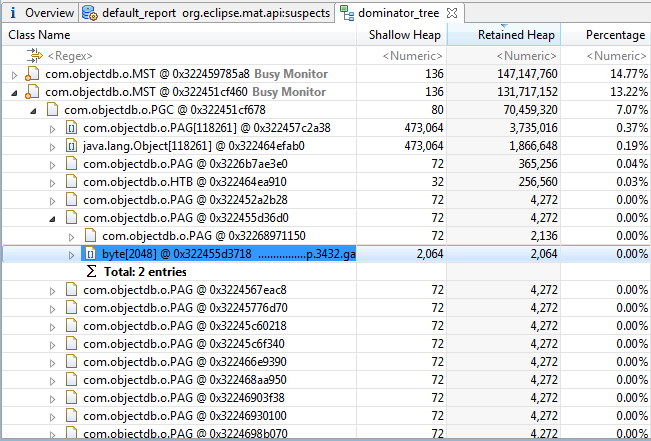
In fact, some com.objectdb.o.MST objects are retaining a huge % of my heap space.
While watching the dump file ( with Eclipse MAT ), i was not able to inspect carrefully the memory leak issue.
That's is very hard to debug because of obfuscated objectdb code.
Well, objectdb is closed source, ok so ... but, in production case, how can a developper do his debug job correctly with your obfuscated code ?
Can you give me some advices about it or a way to do debug easier with objectdb ?
Thanks,
Xirt
NB : I can't give you a dump ( too huge and some data are private )
Edit : I observed some deap objects inside objectdb.MST containing some trace of my entities beans.
It seems objectdb keep in memory some database object. My entities manager are closed ( i'm sure ! ).
I have some EntityManagerFactory ( 10, that's normal ) always open ( that's a correct behaviour ) during the lifecycle of the webapp ( close called on tomcat shutdown ).
Might are they keeping MST objects or a kind of internal cache ? I don't know ...
