ObjectDB ObjectDB

Memory leak in com.objectdb.o.CST

#1

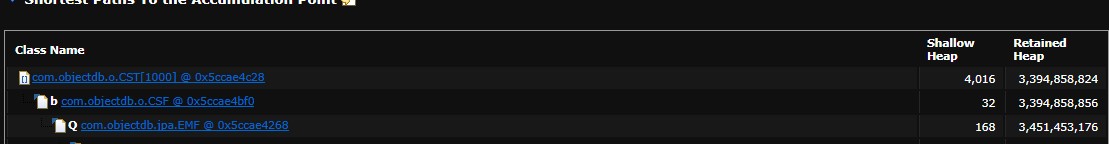
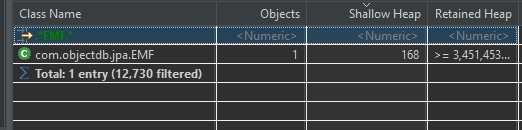
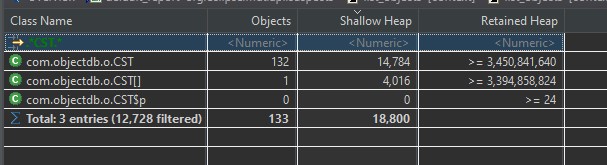
Hi.  I am pretty sure this is something I did wrong.  I have a memory leak where there are over 3gigs allocated in thousands of com.objectdb.o.CST instances as shown in screenshot.  I wonder if you would be able to give me a pointer into what I might have done wrong to cause this, based on your knowledge so I get some ideas of where to look.  e.g. Could this be caused by not closing entity manager, or... I don't know.


Any help would be greatly appreciated.  Thanks!

edit
delete
#2

You have 168 EntityManagerFactory instances. Do you access 168 distinct databases concurrently?

If not and you only have one database, try to build one EntityManagerFactory instance, use it for creating multiple EntityManager instances, and remember to close each EntityManagerFactory and EntityManager instance at the end of use.

ObjectDB Support
edit
delete
#3


Hi I think you have mistaken shallow heap size as instances.  It is only 1 instance of EMF as seen in the better view I uploaded in this reply.


So the question remains.  What could these 132 instances of CST that's taking up 3.4gig be?


Thanks again.

edit
delete
#4

Sorry about the EMF instances mistake. Regarding the CST instances, these are connections to the database. Please check if every created EntityManager instance is closed.

ObjectDB Support
edit
delete
#5

If there is connection pooling, will it be normal that these instances are in memory even if entity manager is closed?

edit
delete
#6

You are right, these objects may exist also in the connection pool. However, the default size of the connection pool is 50, so it is unclear how there are 132 objects. Another option is that maybe your application has 132 concurrent connections to the database (e.g. in 132 different threads).

ObjectDB Support
edit
delete
#7

Can you tell me where all the possible settings to set the connection pool?  

I found this in my persistence.xml

<property name="javax.jdo.option.MaxPool" value="1000"/>

That's a JDO setting, I'm using JPA, not sure if that still affects it.  Or if there is something I can log in the debug to output the connection pool settings to confirm?

edit
delete
#8

Yes, this setting will affect. ObjectDB can be used with JPA and JDO alternately.

ObjectDB Support
edit
delete
#9

So I was wondering, as you can see each CST instances in there are 54MB.  Is that a normal size for those objects?  What are the things that affect the sizes of the CST objects?

The reason I'm asking is so I can budget for what pool size I should use.  Because even if I use the default pool of 50, it will still be 2700MB used.  But if the size can get even bigger, I need to know what affects it so I don't run out of memory using the wrong size for pooling.

edit
delete
#10

Just to add to my last post(since forum edit doesn't seem to work) in the CST objects, it is specifically the BRY objects that's taking up all the memory.  Just FYI.

edit
delete
#11

54MB for every connection does seem high, but we will need more information to check it. A BRY class is not found, maybe it was BYR? If you can send a full heap dump it would help.

ObjectDB Support
edit
delete
#12

Here it is: https://objectstorage.us-phoenix-1.oraclecloud.com/n/yzhk5oemdvbe/b/coc/o/misc%2Fdump.hprof

edit
delete
#13

Thank you for the heap dump, which indeed shows that in this case (of apparently connections that have been used for very large queries) the connections in the pool hold unreasonable memory space.

Please try build 2.8.5_04 which should work better.

ObjectDB Support
edit
delete
#14

OK Thanks I will try it and write back on results.

edit
delete
#15

I have done a preliminary test.  Did some real big queries and the CST objects remain small this time.

I have put installed the new version to my prod server now as well and will observe the memory usage.

However I did notice that the objectdb process seem to have alot more spikes than usual.  My server's graph is usually fairly flat before this update.  Perhaps there is some performance tradoff with this update to save memory usage?

In the attached screenshot the dark blue is my java server.  The light blue is object db.

edit
delete
#16

I've also attached 2 svg files.  One during normal times when no spikes.

The other one, since I could not catch the spikes when I had the profiler ready(I keep missing them) I just loaded the server on some heavy queries, perhaps they are the same thing as the spikes I'm trying to catch, or perhaps not, I can't say.  But anyways.  If you compared the normal svg with the "LoadedOnPurpose" svg, you will notice that the loaded version has lots of red.  The green part is the work done on your java code(object db code) the red part is the jvm, and usually when the red part is big it mostly is due to garbage collection.

If I am correct, then perhaps there's aggressive garbage collection happening to clear the memory from the CST/BYR objects.  I'm not sure if this is an issue but perhaps you can load test it and compare it to objectdb-2.8.3_05(my prior version before this update) and see if there's a performance difference.

edit
delete
#17

Just an update, after a couple hours of using latest version in production, object db process started using lots of processing power and the server grinded to a halt.  There were nothing unusual with my server activity that's out of the ordinary. 

Anyhow, before I shut the server down for restart I took a cpu profile snapshot of objectdb.  It was all JVM processing and not objectdb, so not a lot to show. I can only guess that something is not right with this update as this never happed before.


edit
delete
#18

Sorry for all the posts.  I think you can safely skip most of what I posted earlier.

It seems like if I do several heavy queries I ObjectDB can crash.  How do I avoid this?

[2021-04-22 19:22:23 #5 server]
java.lang.OutOfMemoryError: GC overhead limit exceeded

[2021-04-22 19:22:23 #6 server]
java.lang.OutOfMemoryError: GC overhead limit exceeded
        at com.objectdb.o.BYR.r(BYR.java:568)
        at com.objectdb.o.VUT.j(VUT.java:400)
        at com.objectdb.o.VUT.j(VUT.java:380)
        at com.objectdb.o.CMV.<init>(CMV.java:70)
        at com.objectdb.o.VUT.b(VUT.java:694)
        at com.objectdb.o.VUT.j(VUT.java:394)
        at com.objectdb.o.VUT.j(VUT.java:380)
        at com.objectdb.o.VUT.b(VUT.java:657)
        at com.objectdb.o.VUT.j(VUT.java:394)
        at com.objectdb.o.VUT.j(VUT.java:380)
        at com.objectdb.o.SBI.d(SBI.java:88)
        at com.objectdb.o.OBI.Z9(OBI.java:245)
        at com.objectdb.o.BQI.Zh(BQI.java:153)
        at com.objectdb.o.PRG.d(PRG.java:795)
        at com.objectdb.o.PRG.h(PRG.java:724)
        at com.objectdb.o.PRG.g(PRG.java:560)
 

edit
delete
#19

OKI think this case is closed!  I realized that when I updated to latest version, the server.sh script's xmx was 256mb, which is too small for me.  I had it configred at 4g before the update, but the way I updated was by copying all the files from the 2.8.5_03/bin/* to my existing bin folder, which overrode the server.sh script.

After I set it back to 4g I was no longer seeing these issues.  If I run into issues again I'll create another ticket.


Thanks!  Great update!

edit
delete

Reply

To post on this website please sign in.