ObjectDB ObjectDB

EM.find() is suddenly slower

#1

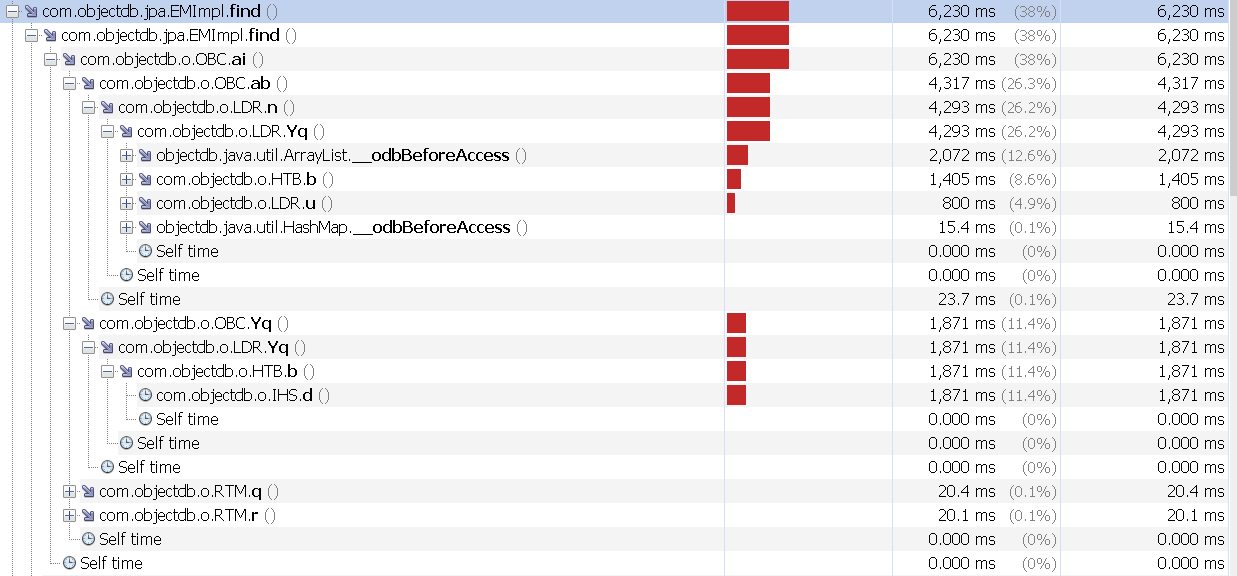
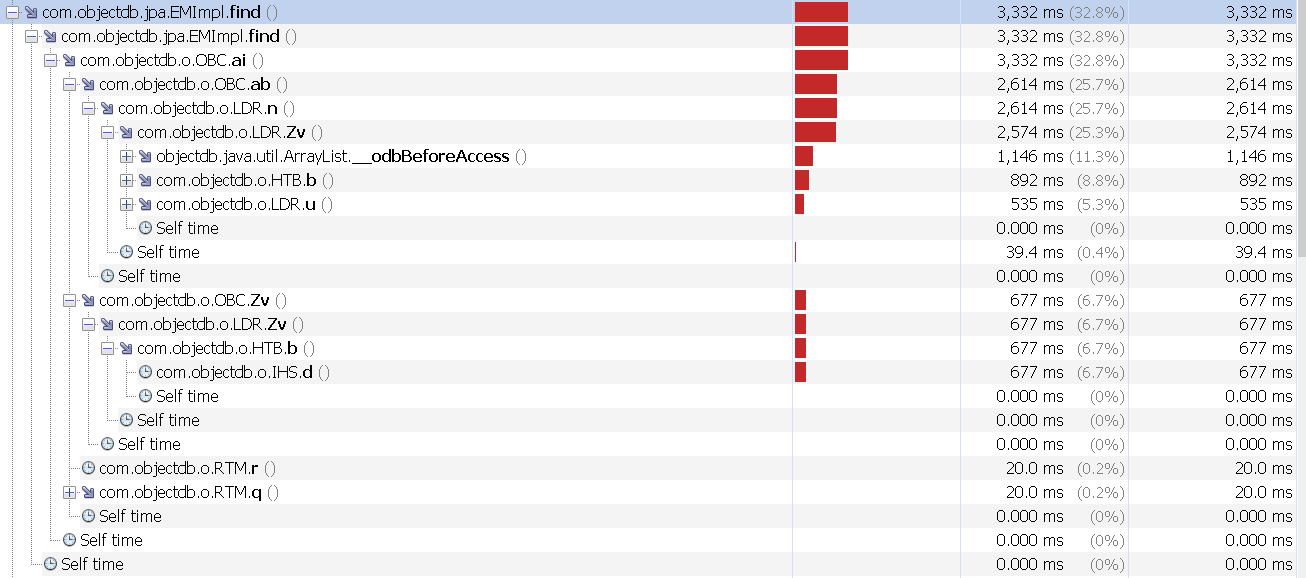
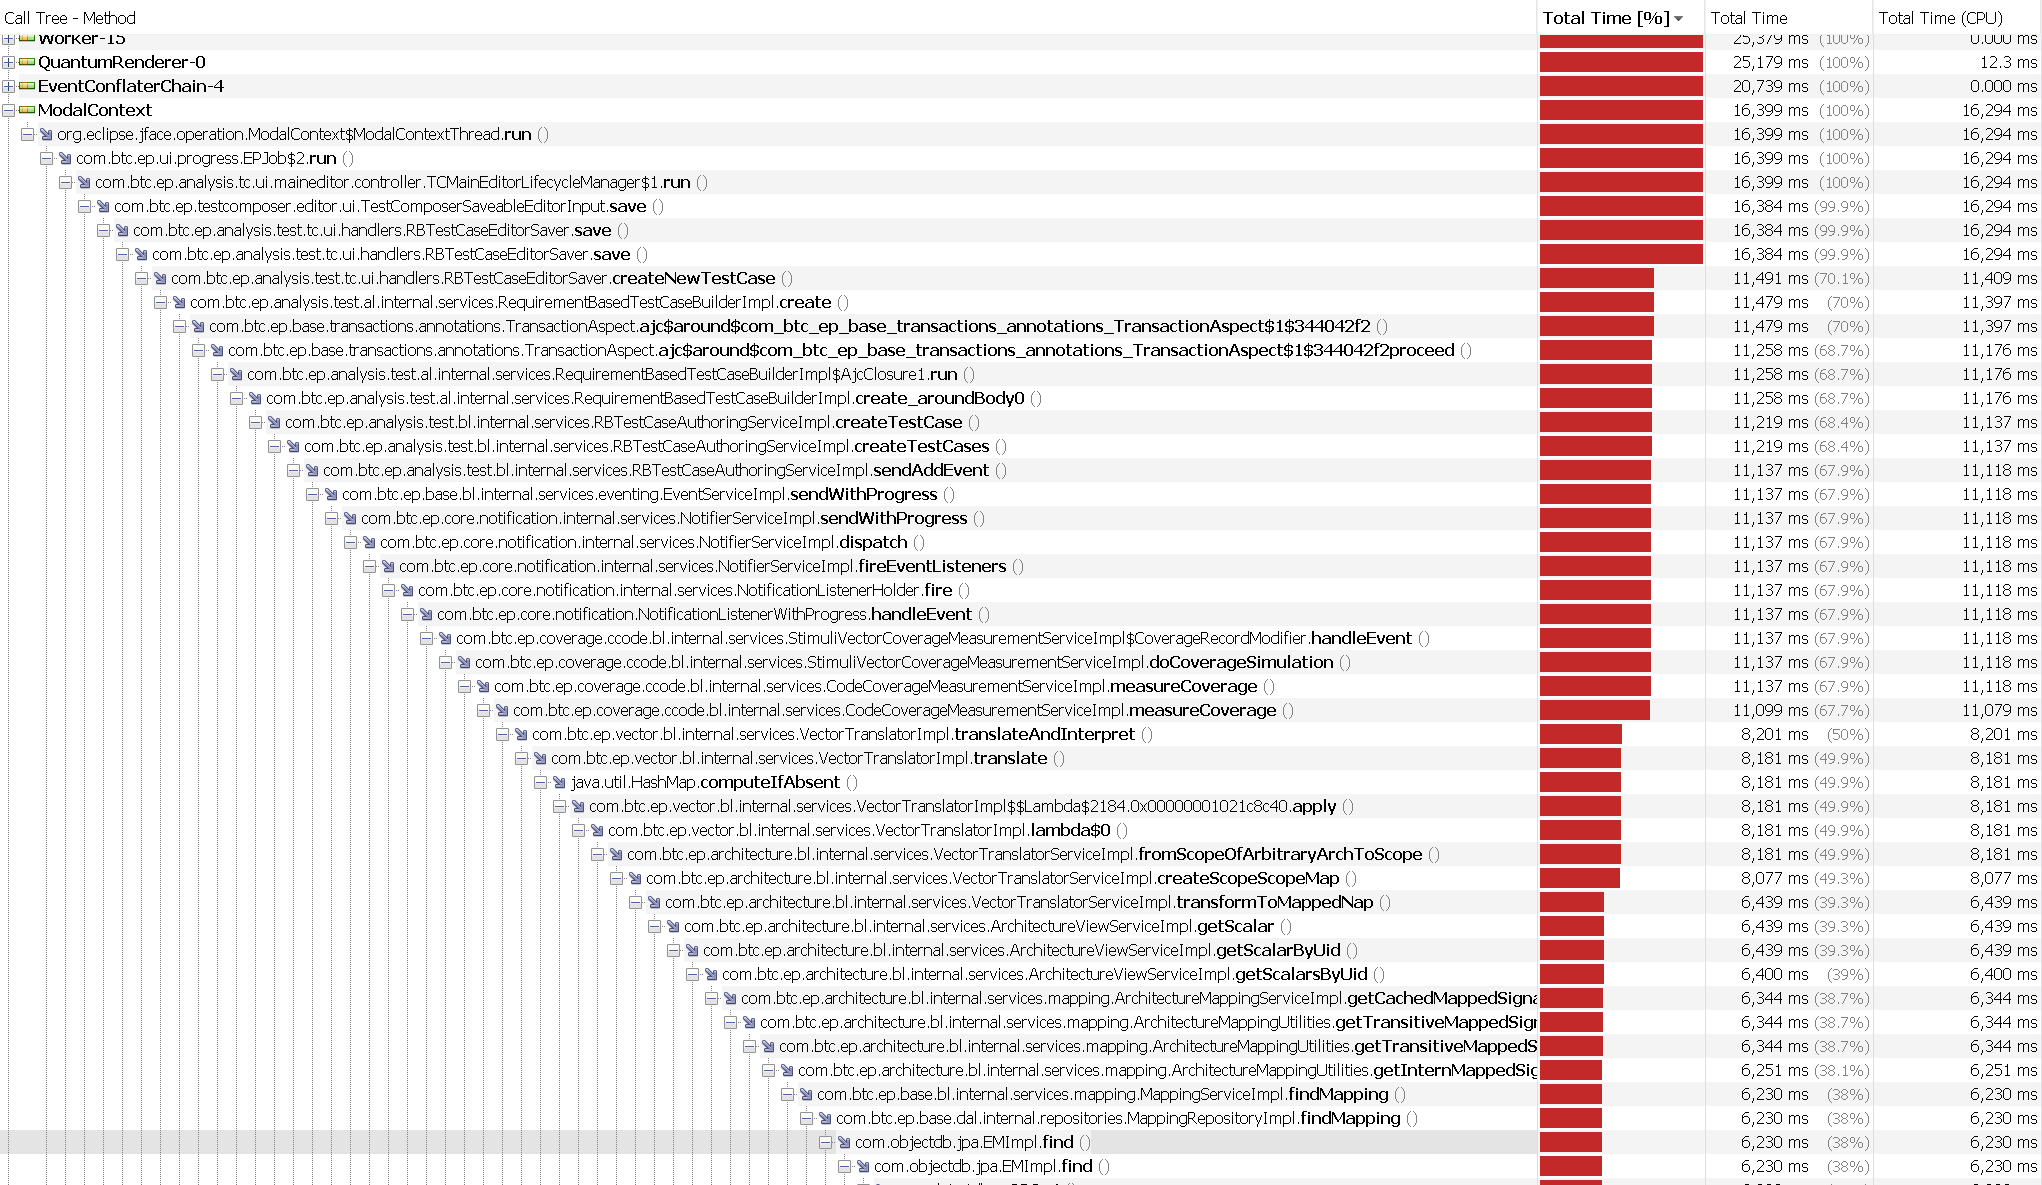
We have a new performance bottleneck, if we use EM.find() on the same entity type 10.000 times in order to get 10.000 different entity instances. For use cases which call the EM.find() only 1000 times we cannot see a performance bottleneck.


@Entity
public class EntityA {
    @Id
    @Access (AccessType.FIELD)
    @Column (name = "uid")
    private String uid;

    @OneToOne (fetch = FetchType.EAGER, cascade = {CascadeType.REFRESH, CascadeType.DETACH })
    private ModelElementImpl element;

    @OneToMany (fetch = FetchType.EAGER, cascade = {CascadeType.REFRESH, CascadeType.DETACH })
    private HashMap<String, List<ModelElementImpl>> mappingMap = new HashMap<>(1);
}

ModelElementImpl is also an entity and was not changed regarding the field structure.

Actually we cannot see any difference in the source code which can cause the bottleneck.

Do you have an idea?

I added two profiling pictures for slower and faster measurements.

edit
delete
#2

The information in the screenshot is limited, but maybe it indicates spending too much time in getting data from the L2 data cache (e.g., due to limited RAM and large cache that might be swapped to the disk?). Try to disable the L2 data cache or decrease its size, assuming you use it.

ObjectDB Support
edit
delete
#3

Our second level cache is not activated:

<cache ref="weak" level2="0" />

Do you have another explanation?

edit
delete
#4

It may help if you could share the profiling data, or at least expand the main nodes in the picture further.

ObjectDB Support
edit
delete
#5

I added both profiling results and an image for the start path where you can find the hotspot in the profiling.

edit
delete
#6

Thanks. It is unclear how exactly these new files are related to the first posted files. Could you please explain where in the profiling data (e.g. when opening the nps file in VisualVM) the issue is shown? i.e., in which threads, etc.

ObjectDB Support
edit
delete
#7

Yes, as mentioned you can see the thread and the pathin the attached image start_path.png (104 KB) above.

edit
delete
#8

It might be related to a large eager fetch that affects the performance of further operations.

Could you please check build 2.8.6_06 that tries to improve performance in such cases?

If it doesn't help, please check if you can reduce the size of the eagerly fetched graphs of objects.

ObjectDB Support
edit
delete
#9

Thank you for the patch.

Indeed the performance is better now.

edit
delete
#10

Good. Thank you for this report and for the update.

ObjectDB Support
edit
delete

Reply

To post on this website please sign in.