Memory Leak in EntityManagerFactory ?

#1

Hi

While trying to improve our server with profiler I've encoutered some memory issues that I don't understand.

1. the server is running in embedded mode
2. the static EntityManagerFactory (m_manager_factory in the example) is opened via

   m_manager_facory = Persistence.createEntityManagerFactory(db_name)

3. After runnings some automatic tests for ca. 1 h all EntityManagers are closed and removed from memory (checked in the Profiler)

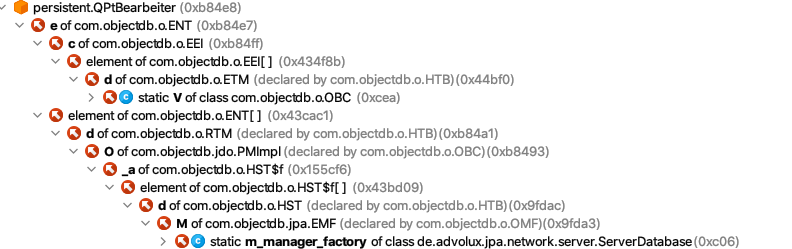
4. nevertheless there are lots of identical Copies of Entities in the memory (QPtBearbeiter in the example). There are only 8 entities of QPtBearbeiter in the Database but more the 236 Copies of those entitities in the memory (after closing all EntityManagers and of course running garbage collector)

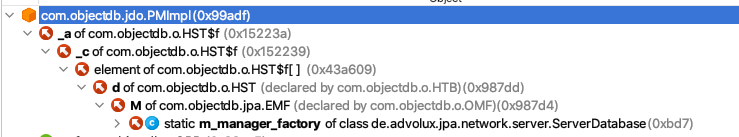
5. the gc root of all those objects is our single and static EntityManagerFactory Object (i.e. m_manager_factory) as you can see in the screenshot of the profiler.

First i thought it might be the L2 Cache or something simular but then i could not understand why there are 236 (as it seems idendical) copies of this Entity.

Of course other entities (but not all) are affectet which results in a slow but increasing memory consumtion of our server. With really big databases some customers told us that they need to restart the server after some ours (there might be some additional issues from our side).

Could you please give me a hint how we could avoid this behavior. I'v added a screenshot from the profiler.

best regards

Arne

PS.: upload seems not work for me. the png file is corrupted after upload (and download).
       or does I miss something ?
       can you please give me a hint how to proper upload the file?


PPS: thanks copy & paste works perfect


#2

The website was updated recently and there are some issues, sorry for trouble. Actually you uploaded the image correctly but it was set as private due to permission issues. This was fixed now. You may also embed images in the post using copy & paste. So you may try both methods now and choose whatever works better for you.

ObjectDB Support
#3

The image indicates that the object is referenced from an EntityManager in the connection pool of a live EntityManagerFactory, where that EntityManager has not been cleared as expected.

Looking at the relevant ObjectDB code it seems that this situation could happen if an EntityManager is closed while a transaction is still in progress (i.e. begin with no commit or rollback). Possibly, this behaviour is to avoid cleaning objects that are still in use, although this doesn't seem to be the best action in such cases, so we may have to change it.

Anyway, if this diagnosis is correct then a possible solution on your side may be to check and commit / rollback any active transaction before closing an EntityManager, which is a good practice, anyway:

    if (em.getTransaction().isActive())
        em.getTransaction().commit();
    em.close();

Another operation that you can try if the above doesn't help is clearing before closing:

    em.clear();
    em.close();
ObjectDB Support
#4

thanks for quick reply. Currently the close mechanism works like this

if (manager.getTransaction().isActive() { // Condition A
   manager.getTransaction().rollback(); 
}

      ...

if (manager.isOpen()) {                    // Condition B
   try {
      manager.close();
   } catch (Exception e) {
      ...
   }
}

thats because (in my opinion) there could not be an open transaction at close time so I think Condition A will never happen (but I'll check). Should I remove the isOpen() Condition B? I will also try to call clear.

The close call is done in a background thread (pooling). Could this cause the issue?

What I found is, that there are 248 com.objectdb.jdo.PMImpl Objects left, and the root gc is as well the EntityManagerFactory Object m_manager_factory.

I think com.objectdb.jdo.PMImpl  is the implementation of entity manager. Is there something to do after closing the entity-manager and set the reference to null?

best regards

Arne

#5

I changed to

 manager.clear();
 manager.close();

without Condition B 'isOpen()' but that doesn't change the issue (of course there are less entities because I testet only for 15 min).

#6

In that case we have to look elsewhere.

When applying clear before every close (post #5), do you still see the QPtBearbeiter instances or just many PMImpl objects but with no QPtBearbeiter instances?

One direction forward is to count all the invocations of emf.createEntityManager and em.close and see if the numbers are synchronized, as not closing all EntityManager instances can cause such issues.


ObjectDB Support
#7

My first impression is, that it only happens if there is a transaction beginn and commit before closing. Only reading from entity manager doesn't increase the amount of PMImpl and QPtBearbeiter ( I will deliberatly check it tomorow).

#8

create_cound and close_count are identical.

I made create_count++ and close_count++ each synchronized. And in the end, there was no memory leak at all. Removing the synchronized and I could see the memory leak.

First i thought this could be the solution but after some tests it seems that it is a little more tricky, because I could not reproduce with 100%. For me it seems to be a racecondition problem wich ist typically difficult to reproduce. Maybe even issues like profiling or printing in the console might intefere.

Until now the tests are executed from several (GUI) Clients, which is not at all comparabale. So I'll try to create a fully automatic test to investigate in that issue in a more reproducable way. I even will try to differ between access with and without transaction to get more clarity.

#9

This is an interesting report, which provides a general indication, although the exact issue is still unclear.

Opening and closing EntityManager instances is already synchronized in ObjectDB using the relevant EntityManagerFactory as a lock object. In your test case you only have one EntityManagerFactory, right?

It may be interesting to check using AtomicInteger instead of synchronized for the count, as it provides a local protection on the count only. The synchronized statement has additional side effects.

If you find that the number of open and close invocations is the same and you still have a memory leak then this may be an issue in ObjectDB. On the other hand, if you find that the call to close is simply skipped in some cases due to a race condition you will have to check on your side how to fix it (e.g. by using synchronized on a larger section of code).

ObjectDB Support
#10

Thank you for your activity. I had to pause investigtion until next week and 'll try to create reproducable tests.

Reply