ObjectDB ObjectDB

virtual servers and one file

#1

Hi ObjectDB Team

In the past, we have often found that our customers use virtualized servers where the hard drives are also virtualized. From a certain size of the objectdb file (approx. 1.5 GB), there is a massive drop in performance. We have already seen that queries take more than 20 seconds instead of a few milliseconds.

Copying the database to an explicit server solves the problem, but the desire for virtualization is apparently increasing.

We suspect that Object DB uses random access files access and only part of the virtual file is in the virtual server's cache. Have you ever heard of this? Our only current workaround is to swap out older Entities entirely, but of course that's a crutch. Could there be a way in the future to split the database across multiple files?

Thank you and best regards Arne

edit
delete
#2

Hi,

> We suspect that Object DB uses random access files access and only part of the virtual file is in the virtual server's cache. Have you ever heard of this?

We are not aware of this issue (no previous reports). A drop in performance from a few milliseconds to up to 20 seconds is extreme and requires further investigation. Your suggestion that partial caching of the database file is the reason seems reasonable and maybe this could be solved with a different virtualization configuration. If the physical machine has sufficient RAM for caching the entire database but the virtualization space is limited then obviously this can cause a performance drop.

ObjectDB 2.x does use RandomAccessFile. ObjectDB 3.0, which is currently under development switched to memory mapped files, which are usually more efficient. It is unclear, however, if this will solve the issue, as virtualization might kill the ability to use the full resources of the physical machine either way.

> Could there be a way in the future to split the database across multiple files?

This is indeed under consideration but could you please provide more information regarding how breaking a database into multiple files, for example one file per entity class, may help with this particular issue?

ObjectDB Support
edit
delete
#3

Thanks for quick respond


Actually we rely on customer stories and what we see in remote sessions. As far as I understand it is not the problem of less memory of the physical or virtual machine. It seems to me (but only guesswork) that there is a (maybe configurable) limit per file in the virtualized harddisk.  As of my understanding each virtual file is (depending on the size) not completly loadet in memory and the virtualisation software tries to make a prediction for the next access, which should be easy for linear streaming and difficult for random access files.

> ... but could you please provide more information regarding how breaking a database into multiple files

If there is a limitation per file (also guessed) then splitting in several files might solve that problem, wether in a file per entity or just depending on continous primary key.

I will try to get an access to an virtualized server and setup a testcase. My idea is to workout the treshhold value and then I try to open several databases in parallel which in sum exceeds the treshhold and compare the response time. I don't know the data structure of the objectdb file to force access to distant file areas. Maybe depending on the creation date?

best regards

Arne


edit
delete
#4

Thank you for the information. Further details of your investigation, as well information regarding the specific virtualization software and configuration involved, will be welcome.

> I don't know the data structure of the objectdb file to force access to distant file areas. Maybe depending on the creation date?

It depends on your schema. Assuming you want to simulate random access (rather than a complete scan) you can retrieve objects with random primary keys (you can keep all the primary keys in memory or use a simple test database with a continuous range of simple numeric IDs). If you want to cover indexes as well you will have to repeat this operation with every index (i.e. retrieve object by indexed values), but for a simple test you can also have a database with no indexes.

ObjectDB Support
edit
delete
#5

Hello everyone,

I have a surprisingly wise quite similar problem. I work for a law firm that uses a software on Windows Server 2016 that is based on an ObjectDB. This server runs virtualized on ESXi 7.03, the server host itself has 2 CPUs each with 16 cores a 2.3 Ghz plus Hyperthreading and 128GB RAM. The virtual server is assigned 56 cores and 100GB of RAM. The hard disk storage consists of a RAID5 of 4x 2TB SAS-SSDs and brings a write and read performance of 4 gigabytes per second. So actually an absolute overkill for the 7 employees on the Windows Terminal Server 2016. If only 1-2 people work with the software at the same time, everything runs as fast as you would expect. However, as soon as more than 3 people are working at the same time, database queries sometimes take 45 seconds until the entries in the calendar are displayed, for example. The software support of the law firm software can't explain it either, but says that a database server installed directly on the hardware, i.e. not virtualized, does not show this problem. 
What is going so wrong that virtualization from the market leader VMware slows everything down so much?

edit
delete
#6

Thank you for this report.

There are several lists of suggestions on the VMware website that you may want to examine:
https://kb.vmware.com/s/article/1008885
https://kb.vmware.com/s/article/1008360
https://kb.vmware.com/s/article/2088157

For example, are you using hardware or software RAID? Is the disk encrypted? Are the database and the OS on separate hard drives? and maybe the most important check, is there sufficient allocated RAM (including to the JVM heap)?

Hopefully the issue can be solved with the right setting, as ObjectDB is a pure Java library / application with no direct access to the OS or the hardware. If you can publish diagnosis info of the slow activity it might help.

ObjectDB Support
edit
delete
#7

Thank you for the quick reply,
I have checked all the links to VMware's knowledgebase for matches. None of them match. The virtual server is blazing fast on all other tasks as well, I rule out an I/O problem. The ObjectDB is currently a little over 3GB in size, the respective server service is assigned 8GB RAM with the parameter -Xmx8192m, this memory is also used completely, even a change to 16GB is fully used, although the database is only 3GB in size. The speed problems also occur only from 3 simultaneous users of the application. 
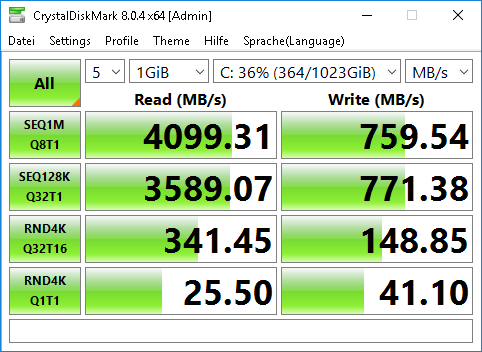
The operating system is on a separate disk, the database as well as the application on a separate disk. These two virtual disks are in turn on a VMFS partition from VMware. This partition is on a hardware RAID 5, consisting of 4x2TB Enterprise SSDs managed by a Megaraid controller with activated cache. I have attached a screenshot of the measured speed.


edit
delete
#8

The partitions are unencrypted.

edit
delete
#9

> The ObjectDB is currently a little over 3GB in size, the respective server service is assigned 8GB RAM with the parameter -Xmx8192m, this memory is also used completely, even a change to 16GB is fully used, although the database is only 3GB in size. 

This may indicate an issue. Do you have information about memory consumption in a similar load but with no virtualization? Can you send heap dump information regarding the full heap (mainly when virtualization is used)? It may help to see which objects fill the heap and whether they are reachable from root objects, etc.

ObjectDB Support
edit
delete
#10

Good morning, thanks for the good tip. However, I could install Advolux locally with the 3GB DB on my personal workstation, but unfortunately I can't simulate simultaneous access of 3+ people on it. Surely I can provide you a dump of the live DB, but unfortunately I don't know how to create it.

edit
delete
#11

I created a dump using the Windows Task Manager and uploaded it. I hope you can do something with it. This dump has about 4GB with 4 applications open at the same time.


edit
delete
#12

Here the same, a few minutes later. 6,6GB

Maybe a problem with GC?

Thanks in advance

edit
delete
#13

We will investigate the heap dumps (downloaded, so you can remove them from your server). The GC does seem very lazy, but it is unclear if this is the issue, as you have not reported OutOfMemoryError, so maybe it is just slow because the heap size is large.

Given that the database size is about 3GB, we should make sure that the entire database is cached in the memory. This can be done in two levels. First, by setting the ObjectDB configuration: try setting the cache attribute to 3500mb. Second, the OS cache: Make sure that the server process has sufficient unused RAM - as the JVM takes the entire 8GB for the heap + additional RAM for other elements, so for example, if the max JVM heap size is 8GB the process should be able to use 16GB. If you see I/O READ operations when the system is warm it indicates that the database is not cached entirely.

ObjectDB Support
edit
delete
#14

Which cache do you mean? Processing cache or query-cache? Or both?

   <database>
    <size initial="16mb" resize="16mb" page="2kb" />
    <recovery enabled="true" sync="true" path="." max="6mb" />
    <recording enabled="false" sync="false" path="." mode="write" />
    <locking version-check="true" />
    <processing cache="256mb" max-threads="40" />
    <query-cache results="256mb" programs="0" />
    <extensions drop="temp,tmp" />
  </database>

edit
delete
#15

<processing cache="256mb" max-threads="40" />

to

<processing cache="3500mb" max-threads="40" />

ObjectDB Support
edit
delete
#16

The format of the heap dump files (posts #11, #12 above) is unknown. Trying to open them with VisualVM fails (hprof files are expected). Anyway, as discussed in #13 above, if no OutOfMemoryError is thrown then this could be the normal (lazy) behaviour.

Have you tried the suggestions in #13 above, i.e. arranging sufficient cache (a) using ObjectDB Configuration, (b) by setting virtualization with sufficient space for file cache outside the JVM?

ObjectDB Support
edit
delete
#17

I increased the cache to 3800MB, adjusted parameter -Xmx8192m to 16384m. But unfortunately no change in speed. 


How can I create the dump that you can also open?

edit
delete
#18

> I increased the cache to 3800MB, adjusted parameter -Xmx8192m to 16384m. But unfortunately no change in speed.

Just make sure that the change was applied to the correct objectdb.conf file (frequently users change an objectdb.conf file that is not is use). Check which configuration file in actually used in the log. You may also insert a deliberate  error in the objectdb.conf file - if the application still starts successfully then this is the wrong configuration file.

Do you still see hard drive read activity when the system is warm - you shouldn't if the entire database is cached.

Can you also check the cache that is available for files of this application by the OS / ESXi?

> How can I create the dump that you can also open?

https://www.baeldung.com/java-heap-dump-capture

ObjectDB Support
edit
delete
#19

I have now created a dump with jmap and uploaded it.

There is only one objectdb.conf on the system, I have attached it:

<?xml version="1.0" encoding="UTF-8"?>
<!-- ObjectDB Configuration -->
<objectdb>
   
  <general>
    <temp path="$temp" threshold="64mb" />
    <network inactivity-timeout="0" />
    <url-history size="50" user="true" password="true" />
      <log path="" max="8mb" stdout="false" stderr="false" />
    <log-archive path="" retain="0" />
    <logger name="*" level="info" />
  </general>
    <database>
    <size initial="16mb" resize="16mb" page="2kb" />
    <recovery enabled="true" sync="true" path="." max="6mb" />
    <recording enabled="false" sync="false" path="." mode="write" />
    <locking version-check="true" />
    <processing cache="3800mb" max-threads="40" />
    <query-cache results="256mb" programs="0" />
    <extensions drop="temp,tmp" />
  
  </database>
  
  <entities>
    <enhancement agent="false" reflection="warning" />
    <cache ref="weak" level2="256mb" />
    <persist serialization="false" />
    <cascade-persist always="auto" on-persist="false" on-commit="true" />
    <dirty-tracking arrays="false" />
  </entities>
    <schema>
    </schema>
  <server>
    <connection port="6136" max="1024" />
    <data path="$objectdb/db" />
    <!--
        <replication url="objectdb://localhost/test.odb;user=xxxxxxxx;password=xxxxxxxx" />
        -->
  </server>
  <users>
    <user username="xxxxxxxx" password="xxxxxxxxxx">
      <dir path="/" permissions="access,modify,create,delete" />
    </user>
    <user username="$default" password="xxxxxxxxx">
      <dir path="/$user/" permissions="access,modify,create,delete">
        <quota directories="5" files="20" disk-space="5mb" />
      </dir>
    </user>
    <user username="xxxxxxxx" password="xxxxxxxxx" />
  </users>
  <ssl enabled="false">
    <server-keystore path="$objectdb/ssl/server-kstore" password="xxxxxxx" />
    <client-truststore path="$objectdb/ssl/client-tstore" password="xxxxxxxx" />
  </ssl>
</objectdb>


Hope this helps... And thank you

edit
delete
#20

What do you mean with "Can you also check the cache that is available for files of this application by the OS / ESXi?"?

There plenty of RAM free at the system

edit
delete
#21

> There is only one objectdb.conf on the system

Still, ObjectDB can ignore it and use its default so to be on the safe side you should do the 2 suggested checks above.

> There plenty of RAM free at the system

Without virtualization the entire RAM can be used by the OS to cache files. This may be the reason that your application works fine without virtualization and with only 256MB internal ObjectDB cache, as the entire database file is probably cached by the OS in the large available RAM. Virtualization can restrict the available resources, i.e. the entire RAM is no longer available for caching files of a specific application. This may be the main difference between running with VMware and without. We cannot provide support and advice for setting and tuning VMware as this is not our specialty.

As suggested, compare the READ activity when the application is warm with and without VMware to see if this may be the difference.

ObjectDB Support
edit
delete
#22

The heap dump was downloaded and it seems to be in the right format. You may delete it from your server.

ObjectDB Support
edit
delete
#23

No issues were found in the heap dump. There is a clear indication that the configuration was updated successfully and a cache size of 3800MB is used. The heap size is 673MB and only about 35MB is used for that cache.

Has this heap dump been taken while the slowness issue occurred? If not, can you generate a heap dump at that time?

If nothing is found in the heap analysis the next step could be collecting profiling data when the issue happens as well as generating several sample thread dumps when that happens.

ObjectDB Support
edit
delete
#24

Sorry for the late reply. First of all, I would like to thank you for your troubleshooting efforts, especially since it is not really your job.

The sent dump was created during the slowness.
And the large cache of 3800MB was actually created in the correct objectdb.conf.

I have now enabled database logging with the level info. It is noticeable that again and again the message "Large number of query plan combinations (32768)" and "Type de.advolux.core.network.helper.AdvoluxUID is not enhanced." appears.
I have attached a RAR archive with more logs. I hope this helps to identify the problem.

edit
delete
#25

The log files show that some queries are complex. However, there is no clue yet why the slowness happens only with virtualization and about 3 concurrent users. Hopefully profiling data can show where time is spent.

If you can create and share a VisualVM nps file, starting before the slow activity and ended just after, it may help.

ObjectDB Support
edit
delete

Reply

To post on this website please sign in.