Occasionally slow requests in load testing

#1

We are running load testing against objectdb version 2.3.7_18. The performance is generally OK, however there are quite a few "spikes" in the performance where we are getting a lot of very slow response times from the DB, around 10 - 15 seconds. Looking at the DB server process with AppDynamics we can see that most of the requests get stuck in one of 2 places:

com.objectdb.o.PGC:w: line number 232

com.objectdb.o.LFL:U: line number 1068

Please see the attached callgraph examples for full stack trace examples.

Given that the code is obfuscated we have no idea what it is actually doing. Could you please let us know what it is waiting for? Is it some system resource, synchronization or something else?  If it is some system resource, it is probably quite easy to fix for us, but we have no way of finding out what it is. It does not seem to run out of threads - our monitoring shows around 350 threads in the db server process and it is configured for 400. The server it is running on looks very healthy as well, no issues that I can see.

Thanks,

Natalia.


#2

The first stack trace (com.objectdb.o.LFL:U: line number 1068) indicates massive access to the database file during query processing.

Check the active query. Maybe you have to define a new index or rephrase that query. If the query requires scanning of the entire database and the database file is large - execution time may also be much longer than 10-15 seconds.

The other stack trace (com.objectdb.o.PGC:w: line number 232) is less clear. It points to a synchronized statement. Maybe it is the other side of the first stack trace, which locks that monitor.

ObjectDB Support
#3

This is not related to any specific queries. We are running load test with uniform set of queries and the performance is OK in some cases and is slow in others. Also, the slow response times occur in wide variety of different queries.

I have however traced it to database file resizing. In the test run yesterday we had resize amount set to default 256kb. We had another test run today and I've changed it to 256mb. Now the database file is resized approximately every hour. Each time at the same time we see these slow response incidents. The system seems to destabilize for about 10-15 minutes and then it returns to normal. During these 10-15 minutes we get a lot of slow responses. Not all of the requests during these times are slow, in fact the majority of requests are still OK. However, because these slow requests are so slow (around 10-15 seconds), this is really visible in our test results.

We are running quite a high load - around 25000 calls to the db per minute. This includes variety of read and update queries. 

Could you please describe how the resizing works and what is the best way to tune it?

Thanks,

Natalia.


#4

Also, another question about resizing - if we run a db for a while with the default resize setting, can we increase it later on? Will changing it have any ill effects? Do we need to run the doctor after that?

Thanks,

Natalia.

#5

The way resizing works is briefly described in the manual and no other tuning options are currently available. Changing the  resize attribute will affect existing databases, with no expected ill effects and no need to run the Doctor.

Internally, ObjectDB fills the new allocated pages with zeros and that requires extensive I/O operations. If you are interested, it is possible to add in the next build an option to disable this zero writing in order to see if it helps. If we disable this operation the new allocated pages may contain random data, but I think that it should still work fine.


ObjectDB Support
#6

Thanks, this option would be useful to try.

Regards,

Natalia. 

#7

You should also verify that resizing doesn't cause defragmentation.

Using a separate disk for the ObjectDB database file, if possible, should help.

In addition, using SSD hard drives should also help.

ObjectDB Support
#8

Hi,

We've run another test today with large initial DB size, to avoid resizing. The initial size was set to 4.5GB. It was running great for 6 hours and after that the performance destabilised and did not recover again. As before, most of requests were OK, but there were also a lot of very slow requests.

The db config is as follows:

<general>
  <temp path="$temp/ObjectDB" threshold="8mb" />
  <network inactivity-timeout="0" />
  <url-history size="50" user="true" password="true" />
  <log path="$objectdb/log/" max="8mb" stdout="false" stderr="false" />
  <log-archive path="$objectdb/log/archive/" retain="90" />
  <logger name="*" level="info" />
</general>

<database>
  <size initial="4608mb" resize="256mb" page="2kb" />
  <recovery enabled="true" sync="false" path="." max="128mb" />
  <recording enabled="false" sync="false" path="." mode="write" />
  <locking version-check="true" />
  <processing cache="8mb" max-threads="400" />
  <query-cache results="8mb" programs="500" />
  <extensions drop="temp,tmp" />
    <activation code="AMTF-SC4T-GR1Y-XCJT-EKKB" />
</database>

<entities>
  <enhancement agent="false" reflection="warning" />
  <cache ref="weak" level2="0" />
  <persist serialization="false" />
  <cascade-persist always="auto" on-persist="false" on-commit="true" />
  <dirty-tracking arrays="false" />
</entities>

<server>
  <connection port="6136" max="1000" />
  <data path="$objectdb/db" />
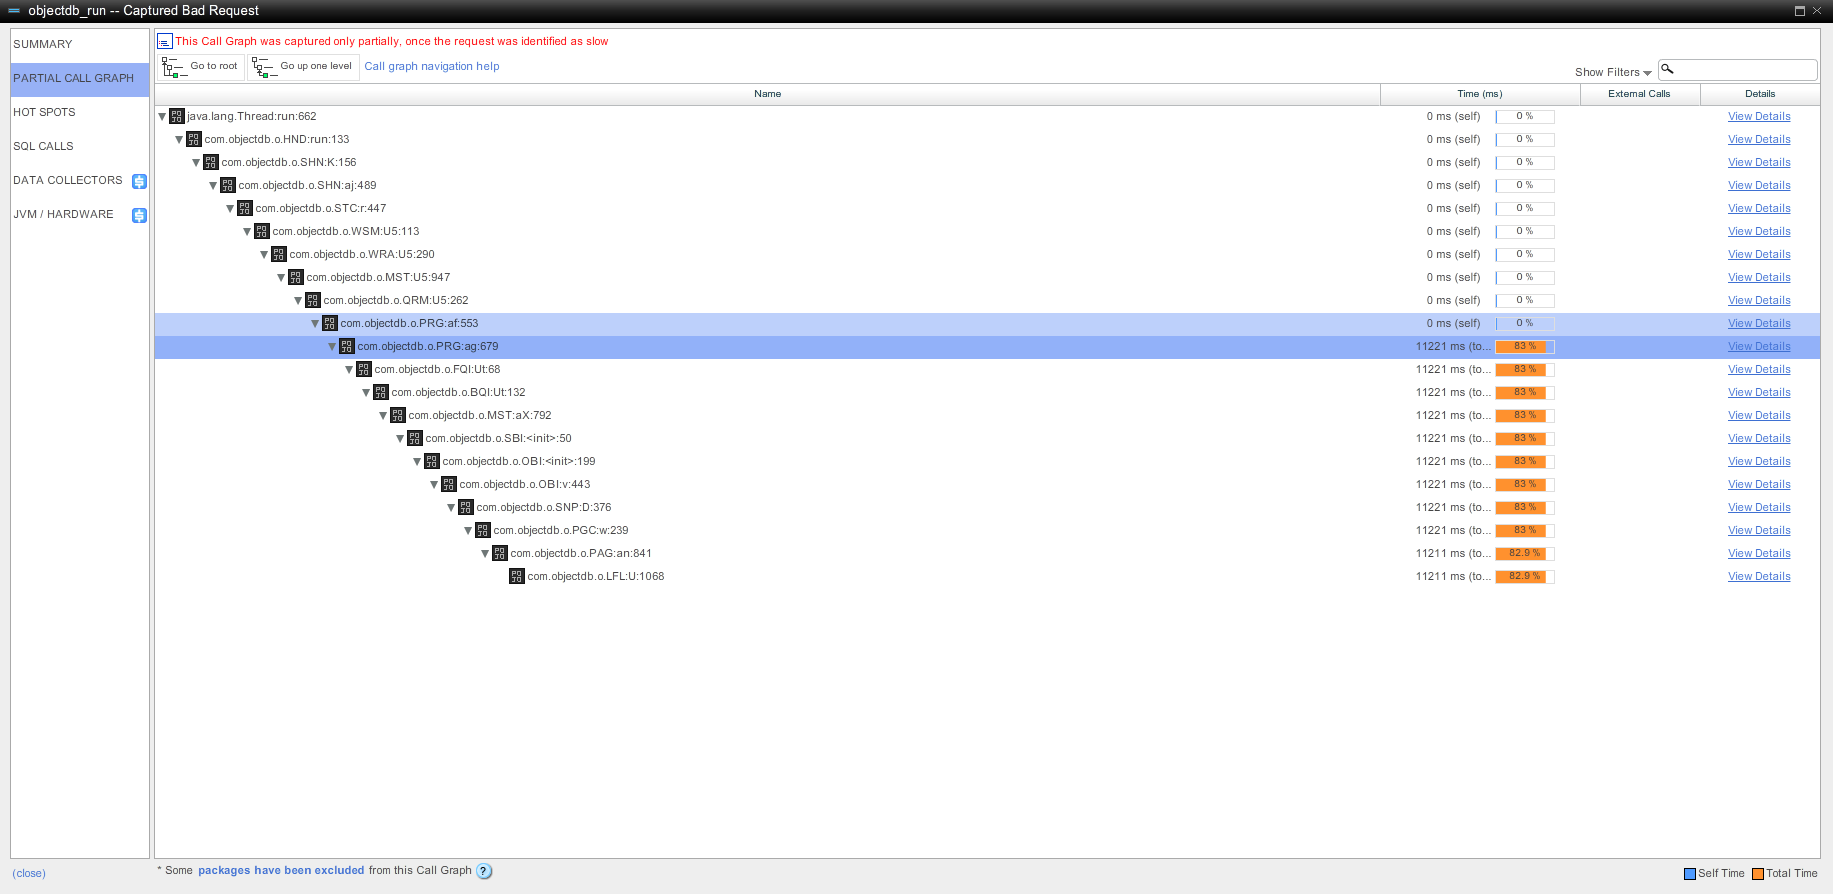
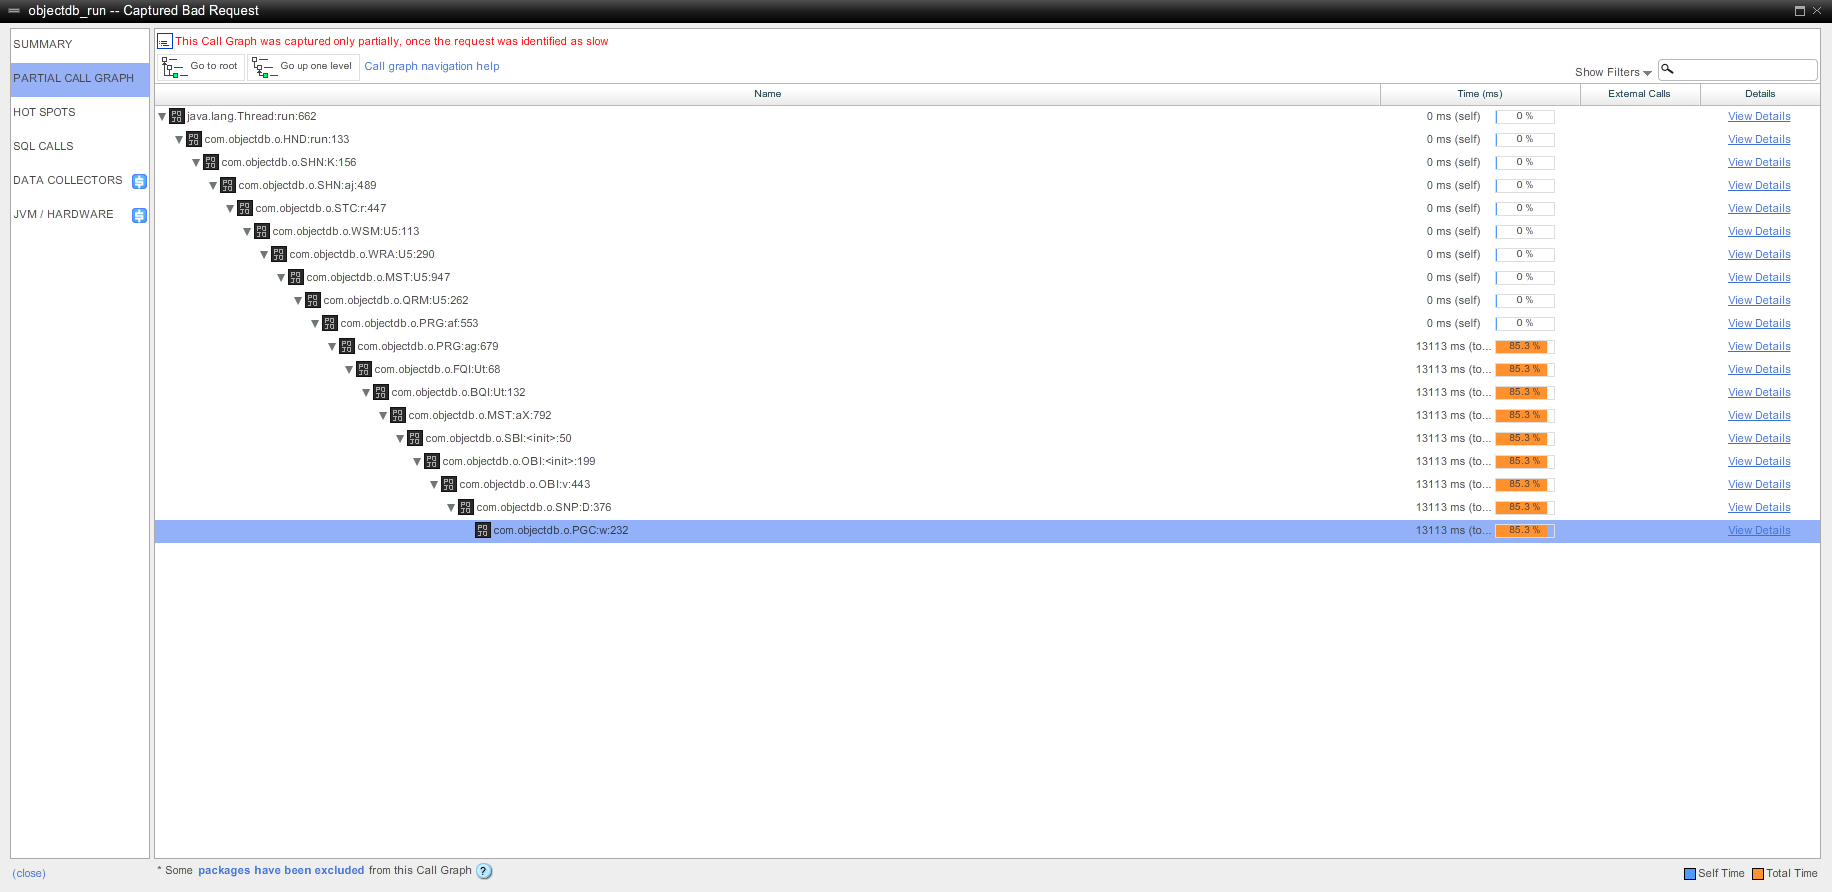
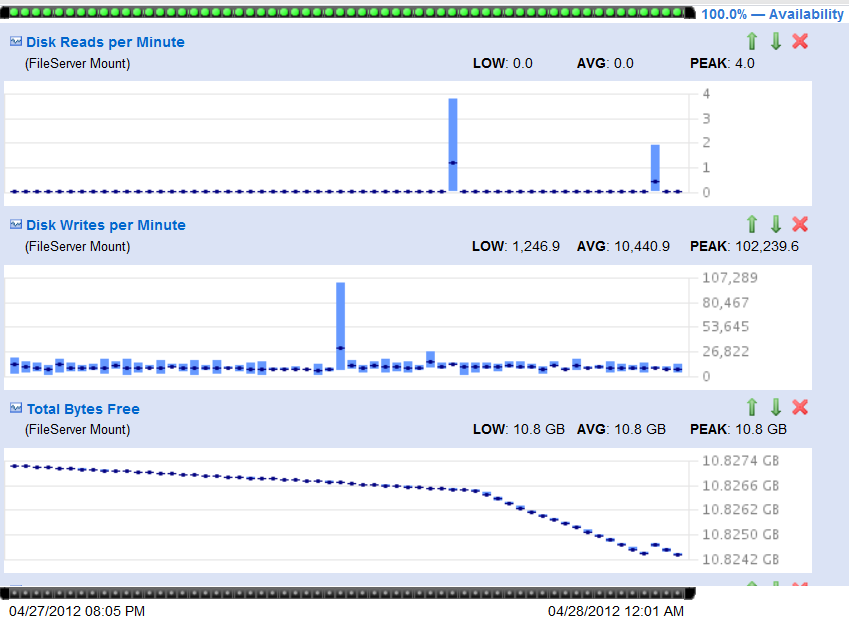
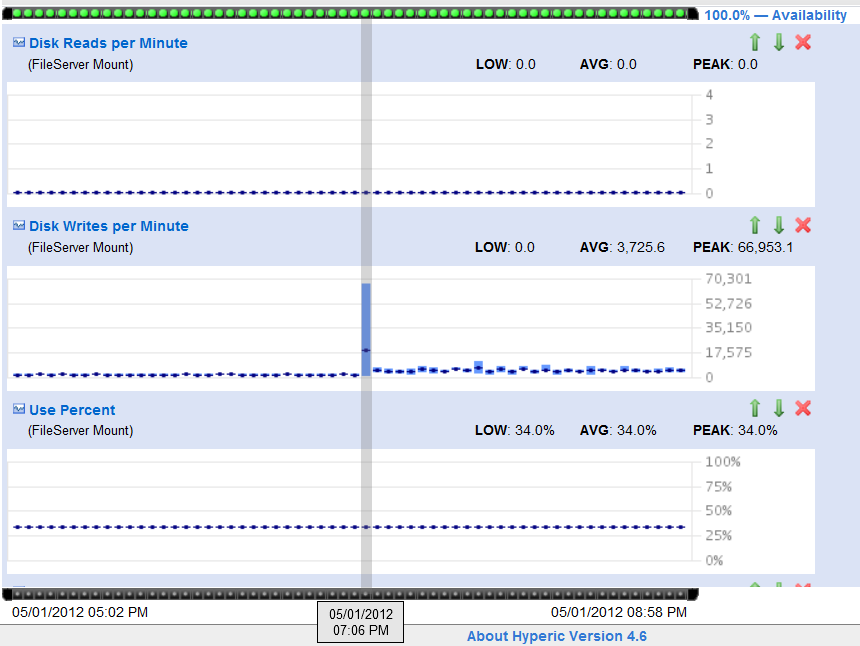
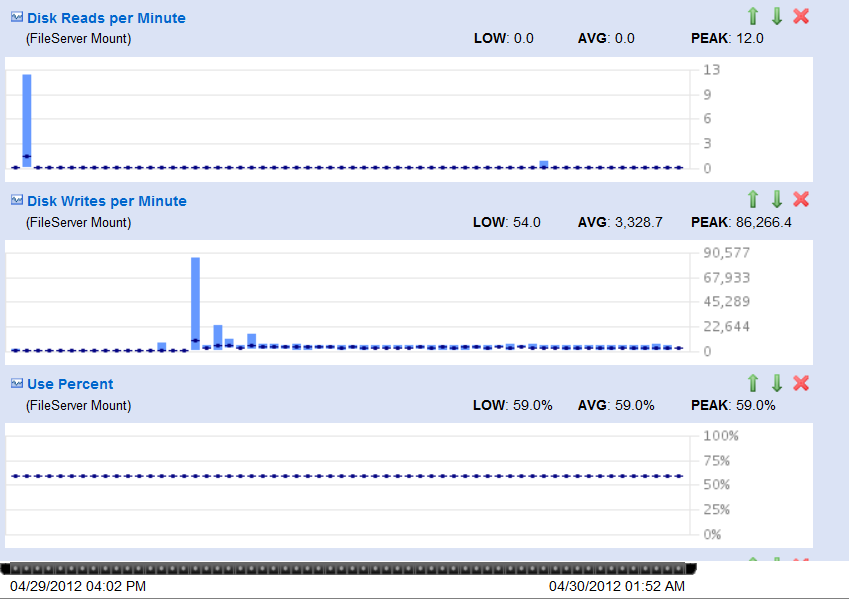
</server>

I've looked at it with AppDynamics again and could see that it gets stuck in 3 different places, which are all different from last time. Please see the attached callgraphs for details. One of these places is java.io.RandomAccessFile:writeBytes, which takes up to 10 seconds. I've also noticed a large IO write spike at the same time the issue has started (picture also attached), but after that IO looked normal. As before, this is a constant load, so the issues is not related to any particular query. Also, I've made a mistake in the last post regarding load we are running - the load is 120000 call per minute, counting every call to com.objectdb.o.SHN:K method.  

Is there anything in the DB apart from the resizing that can cause large file writes? I would estimate the size of actual data in the db file to be around 2 - 2.5 Gb. Are there any limits we could hit? 

Also, another question - would it make sense to try different page size? What effect does it have?

Any advice much appreciated,

Regards,

Natalia.

#9

One stack trace indicates I/O operations and the others seems to be waiting in synchronized.

Here are some ideas for checking:

  • Smaller processing => max-threads (the default is 10 and you are using 400).
  • Different values for recovery => max (try smaller first).
  • Larger processing => cache value.
  • More RAM on the machine.
  • Using a dedicated disk only for the odb file and another dedicated disk only for the recovery file.
  • Using fast SSD disks.

Once in a while the recovery file is emptied and that may consume I/O operations. Maybe smaller max recovery file size will divide that operations to smaller chunks. Try to track the size of the database and the recovery file during the test load.

I will be surprised if different page size will make a sufficient difference.

Also notice that ObjectDB can handle much larger databases, but when the database becomes larger than the available RAM a natural decrease in performance is expected.

ObjectDB Support
#10

Hi,

Thanks for your response. 

Smaller processing => max-threads will not be able to handle the load. The number of threads it was actually using was 380.

How is larger processing => cache value is going to reduce duration of a single write operation?

Machine has much more free RAM than database ever uses. The max heap size of the process is set to 8GB and it never goes over approximately 1GB. There is also plenty of free RAM for any other memory needs.

We are using SSDs in production and 7200RPM drives in testing. This should be sufficient for this purpose. Slow drives also do not explain the behavior we are observing - running fine for 6 hours and then slowing down.

It is of course always possible there is something wrong with the disk and we are checking it. However, it would be helpful if you could tell us what it is doing during those slow disk write operations. Is it actually writing the recovery file to disk or is it related to regular transaction?  

Thanks,

Natalia. 

#11

> Smaller processing => max-threads will not be able to handle the load.

Are you sure about that? More than 10-20 concurrent working threads may cause more harm than good. If you change it to 20 you can still use as many threads as you want in your tests but requests will be queued by ObjectDB. Since you don't have so many CPU cores, some queuing is not necessarily a bad thing.

> How is larger processing => cache value is going to reduce duration of a single write operation?

Writing operations become slower when the disk is busy (including if the disk is busy because of reading).

> The max heap size of the process is set to 8GB and it never goes over approximately 1GB.

In that case a page cache size of 2GB or 3GB may be worth trying.

> Is it actually writing the recovery file to disk or is it related to regular transaction?

The specific stack trace in dbcallgraph1.txt indicates writing to the recovery file, during ordinary commit.

Regarding the file resizing issue - starting build 2.3.7_21 you can try setting a system property, objectdb.temp.no-resize-clear, to true - to enforce a quick file resizing.


ObjectDB Support
#12


>  More than 10-20 concurrent working threads may cause more harm than good. If you change it to 20 you can still use  >  as many threads as you want in your tests but requests will be queued by ObjectDB. Since you don't have so many        >  CPU cores, some queuing is not necessarily a bad thing.

If you are referring to the thread switching, it will not cause 10 seconds wait on writing to disk. This is a dedicated server with 8 CPU cores. The CPU utilisation when the DB is running normally is barely registering and once it starts having this issue it is around 10-15%. If you are referring to something else, I'd like to understand better what you mean. Our tomcat processes are running on similar servers with 800 threads without issues.

> Writing operations become slower when the disk is busy (including if the disk is busy because of reading).

The number of read requests to the disk is at 0 during the test, probably all data is cached. Please see attached IO snapshot db_IO.png, grey vertical line indicates when the issue has started, which coincides with a large write IO spike. Note that this is a dedicated server, so the IO write spike is something to do with the database.


We've ran 2 more tests - with 8mb recovery file and no recovery at all. The test with 8mb recovery file still had the same problem, it started after 8 hours into the test. The test with no recovery had occasional spikes, but it seemed to recover from them straight away. However, I am not fully convinced that this is related purely to recovery - the write IO looked similar to other tests in that it had no write IO for a few hours and then there was a large spike and after that it had low level of write IO activity. Please see the db_io_norecovery.png.


As I mentioned before, the issue seems to be impacting relatively small number of requests. One thing that would be really helpful in order to limit the impact of this issue is to have a per-client configurable timeout on the client size and ideally also ability to retry. 

Kind regards,

Natalia.


#13

> If you are referring to the thread switching, it will not cause 10 seconds wait on writing to disk. If you are referring to something else, I'd like to understand better what you mean. Our tomcat processes are running on similar servers with 800 threads without issues.

ObjectDB usually runs better with dozens internal working threads than with hundreds internal working threads (however, this has nothing to do with the number of threads that you are using in your application). You cannot compare it to Tomcat. In ObjectDB sharing of resources between the working threads (e.g. database pages) is much more extensive so lock competition is more likely. But the number of threads may not be related to this issue, it was only an idea.

> The test with no recovery had occasional spikes, but it seemed to recover from them straight away. However, I am not fully convinced that this is related purely to recovery - the write IO looked similar to other tests in that it had no write IO for a few hours and then there was a large spike and after that it had low level of write IO activity. Please see the db_io_norecovery.png.

In that case you may try using separate disks for the recovery and the database (to minimize the problem without loosing recovery).

> One thing that would be really helpful in order to limit the impact of this issue is to have a per-client configurable timeout on the client size and ideally also ability to retry.

You can try setting a timeout for queries (using a hint).


ObjectDB Support

Reply