ObjectDB ObjectDB

Out of memory

#1

Hi,

Today in the middle of the night ODB just crashed leaving this on console screen:

ObjectDB Server started on port 7136.
Exception in thread "ODB-StoreHandler-29" java.lang.OutOfMemoryError: GC overhead limit exceeded
        at java.lang.StackTraceElement.toString(StackTraceElement.java:157)
        at java.lang.String.valueOf(String.java:2826)
        at java.lang.StringBuilder.append(StringBuilder.java:115)
        at java.lang.Throwable.printStackTrace(Throwable.java:512)
        at com.objectdb.o.InternalException.e(InternalException.java:172)
        at com.objectdb.o.InternalException.printStackTrace(InternalException.java:149)
        at com.objectdb.o.STH.L(STH.java:649)
        at com.objectdb.o.LGR.n(LGR.java:375)
        at com.objectdb.o.LGR.h(LGR.java:205)
        at com.objectdb.o.LGR.g(LGR.java:181)
        at com.objectdb.o.HND.M(HND.java:261)
        at com.objectdb.o.HND.run(HND.java:151)
        at java.lang.Thread.run(Thread.java:662)
Exception in thread "ODB-StoreHandler-39" java.lang.OutOfMemoryError: GC overhead limit exceeded
Exception in thread "ODB-StoreHandler-66" java.lang.OutOfMemoryError: GC overhead limit exceeded
Exception in thread "ODB-StoreHandler-83" java.lang.OutOfMemoryError: GC overhead limit exceeded
Exception in thread "ODB-StoreHandler-30" java.lang.OutOfMemoryError: GC overhead limit exceeded
Exception in thread "ODB-StoreHandler-42" java.lang.OutOfMemoryError: GC overhead limit exceeded
Exception in thread "ODB-StoreHandler-28" java.lang.OutOfMemoryError: GC overhead limit exceeded
Exception in thread "ODB-StoreHandler-103" java.lang.OutOfMemoryError: GC overhead limit exceeded
Exception in thread "ODB-StoreHandler-49" java.lang.OutOfMemoryError: GC overhead limit exceeded
Exception in thread "ODB-StoreHandler-65" java.lang.OutOfMemoryError: GC overhead limit exceeded
Exception in thread "ODB-StoreHandler-63" java.lang.OutOfMemoryError: GC overhead limit exceeded
Exception in thread "ODB-StoreHandler-26" java.lang.OutOfMemoryError: GC overhead limit exceeded
Exception in thread "ODB-StoreHandler-68" java.lang.OutOfMemoryError: GC overhead limit exceeded
Exception in thread "ODB-StoreHandler-43" java.lang.OutOfMemoryError: GC overhead limit exceeded
Exception in thread "ODB-StoreHandler-77" java.lang.OutOfMemoryError: GC overhead limit exceeded
Exception in thread "ODB-StoreHandler-27" java.lang.OutOfMemoryError: GC overhead limit exceeded
Exception in thread "ODB-StoreHandler-109" java.lang.OutOfMemoryError: GC overhead limit exceeded
Exception in thread "ODB-StoreHandler-67" java.lang.OutOfMemoryError: GC overhead limit exceeded
Exception in thread "ODB-StoreHandler-85" java.lang.OutOfMemoryError: GC overhead limit exceeded
Exception in thread "ODB-StoreHandler-75" java.lang.OutOfMemoryError: GC overhead limit exceeded
Exception in thread "ODB-StoreHandler-101" java.lang.OutOfMemoryError: GC overhead limit exceeded
Exception in thread "ODB-StoreHandler-31" java.lang.OutOfMemoryError: GC overhead limit exceeded
Exception in thread "ODB-StoreHandler-108" java.lang.OutOfMemoryError: GC overhead limit exceeded
Exception in thread "ODB-StoreHandler-41" java.lang.OutOfMemoryError: GC overhead limit exceeded
Exception in thread "ODB-StoreHandler-86" java.lang.OutOfMemoryError: GC overhead limit exceeded
Exception in thread "ODB-StoreHandler-123" java.lang.OutOfMemoryError: GC overhead limit exceeded
Exception in thread "ODB-StoreHandler-122" java.lang.OutOfMemoryError: GC overhead limit exceeded
Exception in thread "ODB-StoreHandler-115" java.lang.OutOfMemoryError: GC overhead limit exceeded
Exception in thread "ODB-StoreHandler-126" java.lang.OutOfMemoryError: GC overhead limit exceeded
GC overhead limit exceeded

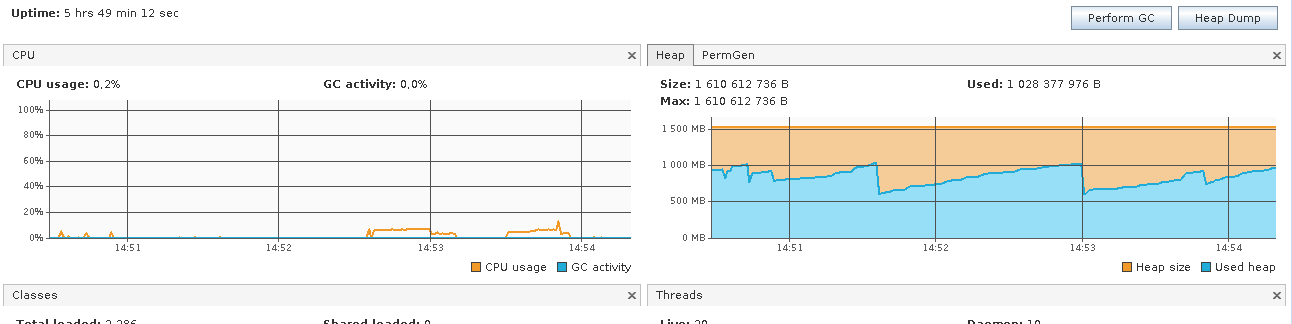
Database size is only 67MB, heap size is set to 1536MB. Log files are empty. Database uptime was about 3 weeks. It's still version 2.4.2_01.

Database workload is read heavy, but some write transactions that are really big (import lot of data from other source). I didn't catch the size of record log file.

For now I turned on heap size monitoring and I will try add more details when there is more problems.


edit
delete
#2

Some new data. After 5 hours of running database memory usage is quite high - attached screenshots.

Record log is almost 50MB large. Database is about 73MB large.

The strange thing is - allocated memory by storage threads stops at the size of database. Maybe there is some kind of glitch with sharing page cache?

edit
delete
#3

Could you please provide more details about the byte[] allocations?

  • Who holds them?
  • What is the common size of the byte[] that fills the heap?
  • How many instances of this size exist?
ObjectDB Support
edit
delete
#4

I can send you a full heap dump - it should be much easier for you to check what you need :) But it will be about 1.5GB large.

edit
delete
#5

OK. You can use FTP to upload large files:

Host: objectdb.com, Username: public, Password: public

ObjectDB Support
edit
delete
#6

I just upload compressed version on my account - file name is heapdump.hprof.bz2.

edit
delete
#7

Apparently many objects in this heap are unreachable, i.e. are actually available for garbage collecting. If you can invoke the GC just before taking a new heap dump (or use a tool that can do that on the existing heap dump) it would be easier to analyze the memory consumption.

Currently it seems that most of the heap space is in use for various caching activities but it is unclear what share can be released by the GC and what cannot be released.

In addition, please post the ObjectDB configuration file (to show cache sizes, etc.).

ObjectDB Support
edit
delete
#8

I just uploaded two more heap dumps: one with only live objects, second one with all objects right after GC. Both of them looks much better and memory usage is almost as with config file.

server.sh

# Launch ObjectDB Server:
exec ${JAVA_VM} -server -Xms1536M -Xmx1536M -cp ${OBJECTDB_JARS} com.objectdb.Server $ARGS

server config:

<objectdb>
        <general>
                <temp path="$temp/ObjectDB" threshold="64mb" />
                <network inactivity-timeout="0" />
                <log path="$objectdb/log/" max="8mb" stdout="false" stderr="false" />
                <log-archive path="$objectdb/log/archive/" retain="90" />
                <logger name="*" level="info" />
        </general>
        <database>
                <size initial="256kb" resize="256kb" page="2kb" />
                <recovery enabled="true" sync="false" path="." max="128mb" />
                <recording enabled="false" sync="false" path="." mode="write" />
                <locking version-check="true" />
                <processing cache="64mb" max-threads="64" />
                <query-cache results="256mb" programs="5000" />
        </database>
        <entities>
                <enhancement agent="false" reflection="warning" />
                <cache ref="weak" level2="0" />
                <cascade-persist always="auto" on-persist="false" on-commit="true" />
                <dirty-tracking arrays="false" />
        </entities>

This big heap space is set after few versions ago ODB was crashing regularly with OOM. With each crash I was rising up heap space up to the moment it is now. 


edit
delete
#9

There are evidences in these heap files for inefficient memory management of ObjectDB in some cases of very large transactions. Build 2.4.3_02 includes an improvement that may prevent an OutOfMemoryError in that case in the future.

Thank you for this report.

ObjectDB Support
edit
delete
#10

Something is really wrong with new build. First, every time I run Doctor or server, ODB is creating directory with some Windows path name:

drwxr-xr-11 lwalkowski  staff        374 20 wrz 11:10 ..
drwxr-xr-x   4 lwalkowski  staff        136 20 wrz 11:17 D:\temp\odb-synthetic
-rw-r--r--   1 lwalkowski  staff  949223424 20 wrz 11:24 HomplexTool.odb

Then, queries that should take about 2-3 seconds on cold database now finish in 300ms:

2012-09-20 11:15:19.139 [http-bio-8080-exec-3] DEBUG o.s.b.f.annotation.InjectionMetadata - Processing injected method of bean 'inspirationIndex': AutowiredFieldElement for private java.lang.String pl.hplxtool.pages.BorderPage.staticUrl
2012-09-20 11:15:19.407 [http-bio-8080-exec-3] INFO  pl.hplxtool.audit.ProfilingAspect - pl.hplxtool.beans.InspirationServiceImpl.getLastModifiedInspirations(10) execution time: 214 ms
2012-09-20 11:15:19.408 [http-bio-8080-exec-3] DEBUG p.h.p.inspiration.InspirationIndex - Before getting maps...
2012-09-20 11:15:20.021 [http-bio-8080-exec-3] INFO  pl.hplxtool.audit.ProfilingAspect - pl.hplxtool.beans.ReportingServiceImpl.getProductQuantitiesPerInspiration() execution time: 612 ms
2012-09-20 11:15:20.021 [http-bio-8080-exec-3] DEBUG p.h.p.inspiration.InspirationIndex - After product demands map...
2012-09-20 11:15:20.186 [http-bio-8080-exec-3] INFO  pl.hplxtool.audit.ProfilingAspect - pl.hplxtool.beans.ReportingServiceImpl.getProductKitsPerInspiration() execution time: 165 ms
2012-09-20 11:15:20.187 [http-bio-8080-exec-3] DEBUG p.h.p.inspiration.InspirationIndex - After product kits map...
2012-09-20 11:15:20.313 [http-bio-8080-exec-3] INFO  pl.hplxtool.audit.ProfilingAspect - pl.hplxtool.beans.ReportingServiceImpl.getInspirationsByModificationDate() execution time: 124 ms

and database throws an exception:

2012-09-20 11:15:21.596 [http-bio-8080-exec-3] ERROR Click - handleException:
com.objectdb.o.InternalException: Unexpected internal exception
at com.objectdb.o.JPE.h(JPE.java:165) ~[objectdb.jar:na]
at com.objectdb.o.ERR.f(ERR.java:70) ~[objectdb.jar:na]
at com.objectdb.o.OBC.onObjectDBError(OBC.java:1505) ~[objectdb.jar:na]
at com.objectdb.o.RSL.get(RSL.java:161) ~[objectdb.jar:na]
at java.util.AbstractList$Itr.next(AbstractList.java:358) ~[na:1.7.0_05]
at com.objectdb.o.RSL$q.next(RSL.java:218) ~[objectdb.jar:na]
at pl.hplxtool.beans.ReportingServiceImpl.getInspirationsPerUser(ReportingServiceImpl.java:478) ~[ReportingServiceImpl.class:na]
at sun.reflect.NativeMethodAccessorImpl.invoke0(Native Method) ~[na:1.7.0_05]
at sun.reflect.NativeMethodAccessorImpl.invoke(NativeMethodAccessorImpl.java:57) ~[na:1.7.0_05]
at sun.reflect.DelegatingMethodAccessorImpl.invoke(DelegatingMethodAccessorImpl.java:43) ~[na:1.7.0_05]
at java.lang.reflect.Method.invoke(Method.java:601) ~[na:1.7.0_05]
at org.springframework.aop.support.AopUtils.invokeJoinpointUsingReflection(AopUtils.java:319) ~[spring-aop-3.1.2.RELEASE.jar:3.1.2.RELEASE]
at org.springframework.aop.framework.ReflectiveMethodInvocation.invokeJoinpoint(ReflectiveMethodInvocation.java:183) ~[spring-aop-3.1.2.RELEASE.jar:3.1.2.RELEASE]
at org.springframework.aop.framework.ReflectiveMethodInvocation.proceed(ReflectiveMethodInvocation.java:150) ~[spring-aop-3.1.2.RELEASE.jar:3.1.2.RELEASE]
at org.springframework.aop.aspectj.MethodInvocationProceedingJoinPoint.proceed(MethodInvocationProceedingJoinPoint.java:80) ~[spring-aop-3.1.2.RELEASE.jar:3.1.2.RELEASE]
at pl.hplxtool.audit.ProfilingAspect.logTimeMethod(ProfilingAspect.java:25) ~[ProfilingAspect.class:na]
at sun.reflect.NativeMethodAccessorImpl.invoke0(Native Method) ~[na:1.7.0_05]
at sun.reflect.NativeMethodAccessorImpl.invoke(NativeMethodAccessorImpl.java:57) ~[na:1.7.0_05]
at sun.reflect.DelegatingMethodAccessorImpl.invoke(DelegatingMethodAccessorImpl.java:43) ~[na:1.7.0_05]
at java.lang.reflect.Method.invoke(Method.java:601) ~[na:1.7.0_05]
at org.springframework.aop.aspectj.AbstractAspectJAdvice.invokeAdviceMethodWithGivenArgs(AbstractAspectJAdvice.java:621) ~[spring-aop-3.1.2.RELEASE.jar:3.1.2.RELEASE]
at org.springframework.aop.aspectj.AbstractAspectJAdvice.invokeAdviceMethod(AbstractAspectJAdvice.java:610) ~[spring-aop-3.1.2.RELEASE.jar:3.1.2.RELEASE]
at org.springframework.aop.aspectj.AspectJAroundAdvice.invoke(AspectJAroundAdvice.java:65) ~[spring-aop-3.1.2.RELEASE.jar:3.1.2.RELEASE]
at org.springframework.aop.framework.ReflectiveMethodInvocation.proceed(ReflectiveMethodInvocation.java:172) ~[spring-aop-3.1.2.RELEASE.jar:3.1.2.RELEASE]
at org.springframework.aop.interceptor.ExposeInvocationInterceptor.invoke(ExposeInvocationInterceptor.java:90) ~[spring-aop-3.1.2.RELEASE.jar:3.1.2.RELEASE]
at org.springframework.aop.framework.ReflectiveMethodInvocation.proceed(ReflectiveMethodInvocation.java:172) ~[spring-aop-3.1.2.RELEASE.jar:3.1.2.RELEASE]
at org.springframework.aop.framework.JdkDynamicAopProxy.invoke(JdkDynamicAopProxy.java:202) ~[spring-aop-3.1.2.RELEASE.jar:3.1.2.RELEASE]
at $Proxy92.getInspirationsPerUser(Unknown Source) ~[na:na]
at pl.hplxtool.pages.inspiration.InspirationIndex.onRender(InspirationIndex.java:362) ~[InspirationIndex.class:na]
(...)
Caused by: java.lang.ArrayIndexOutOfBoundsException: null
at com.objectdb.o.BYW.T(BYW.java:718) ~[objectdb.jar:na]
at com.objectdb.o.RCO.g(RCO.java:179) ~[objectdb.jar:na]
at com.objectdb.o.SHN.ah(SHN.java:465) ~[objectdb.jar:na]
at com.objectdb.o.SHN.K(SHN.java:150) ~[objectdb.jar:na]
at com.objectdb.o.HND.run(HND.java:133) ~[objectdb.jar:na]
... 1 common frames omitted

The same with explorer. Running query returns empty objects and works fine. When you want to unfold object and check all the data, there is an exception:

Exception in thread "AWT-EventQueue-0" [ObjectDB 2.4.3_02] Unexpected exception (Error 990)
  Generated by Java HotSpot(TM) 64-Bit Server VM 1.7.0_07 (on Mac OS X 10.8.1).
Please report this error on http://www.objectdb.com/database/issue/new
com.objectdb.o.InternalException: java.lang.ArrayIndexOutOfBoundsException: null
java.lang.ArrayIndexOutOfBoundsException
at com.objectdb.o.BYW.T(BYW.java:718)
at com.objectdb.o.RCO.g(RCO.java:179)
at com.objectdb.o.SHN.ah(SHN.java:465)
at com.objectdb.o.SHN.K(SHN.java:150)
at com.objectdb.o.HND.run(HND.java:133)
at java.lang.Thread.run(Thread.java:722)

Database is repaired with Doctor, now errors have been found.

edit
delete
#11

Please try build 2.4.3_03 that fixes the "D:\temp\odb-synthetic" directory creation, and disables the new memory management changes - on order to verify that the new problems are caused by the new changes.

ObjectDB Support
edit
delete
#12

New build works OK. No more strange directories and every query works fine.

edit
delete
#13

The cause of the errors at #10 is still unclear so the fix of #9 cannot be integrated.

If you can provide an application (not necessarily an isolated test, and no source is required) that demonstrates the exceptions of #10 (with build 2.4.3_02) it may help.

ObjectDB Support
edit
delete
#14

I think I can isolate some queries in a simple test case and send you UTC with database, but I need few days for this.

edit
delete
#15

I was playing with UTC on version 2.4.3_02 and then tried version 2.4.3_06. It looks like everything works fine with latest build. However message from doctor:

Global Value Errors
-------------------

[1] Unexpected last index ID: 3624386649387068524 (expected -317)

[2] Unexpected last type ID: 7882821588231142770 (expected 113)
[3] Unexpected total object count: 3624395444842555492 (expected 3096704)
[4] Unexpected total page count: 2753444525736026431 (expected 463488)

is quite horrifying ;)


edit
delete
#16

Could you please upload the database?

ObjectDB Support
edit
delete
#17

Done. DB is on my FTP account.

Edit:

Wrong database - sorry. I need to re-upload the correct one.

edit
delete
#18

Your database is fine. It was a false alarm of the Doctor that is now fixed in build 2.4.3_07.

Please see #9 - #14 above - that essential fix is still disabled. If you can provide a test that shows the error of #10 it would hopefully enable integrating that fix without side effects.

ObjectDB Support
edit
delete
#19

You can find UTC on my ftp account. Database file: HomplexTool.odb.tgz and UTC file: utc_2.4.3_02.tgz

UTC contains copy of every query in the same order as in our software that lead to Exception.

I can't however reproduce this part of exception:

2012-09-20 13:15:21.596 [http-bio-8080-exec-3] ERROR Click - handleException:
com.objectdb.o.InternalException: Unexpected internal exception
at com.objectdb.o.JPE.h(JPE.java:165) ~[objectdb.jar:na]
at com.objectdb.o.ERR.f(ERR.java:70) ~[objectdb.jar:na]
at com.objectdb.o.OBC.onObjectDBError(OBC.java:1505) ~[objectdb.jar:na]
at com.objectdb.o.RSL.get(RSL.java:161) ~[objectdb.jar:na]
at java.util.AbstractList$Itr.next(AbstractList.java:358) ~[na:1.7.0_05]
at com.objectdb.o.RSL$q.next(RSL.java:218) ~[objectdb.jar:na]


edit
delete
#20

Yesterday our database crashed again with those on stdout:

Exception in thread "ODB-StoreHandler-280" java.lang.OutOfMemoryError: Java heap space
Exception in thread "ODB-StoreHandler-296" java.lang.OutOfMemoryError: GC overhead limit exceeded
Exception in thread "ODB-StoreHandler-301" java.lang.OutOfMemoryError: Java heap space
Exception in thread "ODB-StoreHandler-300" Exception in thread "ODB-StoreHandler-292" java.lang.OutOfMemoryError: Java heap space
Exception in thread "ODB-StoreHandler-299" java.lang.OutOfMemoryError: Java heap space
Exception in thread "ODB-StoreHandler-298" java.lang.OutOfMemoryError: Java heap space
GC overhead limit exceeded

I wonder, how can we find the cause of those problems? It's production env, so there is no way to prepare UTC as load on database is totally random. 

edit
delete
#21

It may be the same problem that needs the fix of #9, which is now disabled.

Do you have a new heap dump to verify that this is the same problem?

Hopefully, using your UTC (#19) the fix could be revised and integrated again.

ObjectDB Support
edit
delete
#22

Not really, when changing version of ODB I forget to add -XX:+HeapDumpOnOutOfMemoryError to startup script. Anyway - I have change this and cut heap size to 512MB, so database should crash much faster.

edit
delete
#23

That was fast. Few hours and the database is dead. I just uploaded heap dump from this crash to my ftp account.

edit
delete
#24

OK. The problem at #9, #10, #11 is responsible for up to 64MB, in this case. That problem was moved to a separate issue, since this thread became too long. Please subscribe to that new issue.

Analysis of the heap reveals no other special problems, but apparently the heap size is too small for the application.

The page cache takes about 74MB, other caches and structures take approximately other 100MB.

Several heavy queries are executed simultaneously and they use a lot of memory. You should be able to reduce the memory that is used by setting the temporary memory threshold parameter in the configuration. The default of 64MB may be too high (because it means using up to 64MB per operation and there are many operations). However, if you decrease that value then temporary files will be used and that may decrease the application performance.

Alternatively, you may also try reducing concurrent memory consumption by using less working threads on the server side.

Maybe changing some queries, setting indexes or using the objectdb.result-fetch hint could help.

Finally, maybe larger heap size would be the easiest solution.

ObjectDB Support
edit
delete
#25

OK, thanks for the information. The page cache is about database size, so it's ok. As I understand, additional 100MB of cache is for indexes, that are load from database?

Now, how to estimate the max heap size? number of worker threads * memory threshold + database size + some cache size? Is there any chance to add some logging for long / memory hungry queries?

And lastly - now our database is small. It's only a subset of our backend database which is about 1.5GB in size now. But I'm afraid that with memory consumption we won't be able to support big enough heap sizes in near future after adding more data.

edit
delete
#26

The additional 100MB is for various tasks, including cache of query programs and query results.

Calculating the required heap size based on expected activity is very difficult. It would be better to monitor the actual total heap size in production and make sure that there is always enough spare space. As long as there are no memory leaks in ObjectDB - increasing the maximum heap size (or configuring ObjectDB to use less memory) should solve the problem.

The database size should not be a problem, except that queries may process larger data and require larger space (and solutions for that are discussed above).

According to the heap, the problematic queries may be queries that return a lot of data, as well as queries that use GROUP BY and ORDER BY, in which large data has to be processed. Unfortunately additional data is currently unavailable.

ObjectDB Support
edit
delete

Reply

To post on this website please sign in.