each 1-2 days we have the situation that our system changes to a completely underperforming mode. In the attched thread dump you can see that some threads block each other. We only do pure select queries without any object manipulation in these threads
Issue #2327: each 1-2 days objects on some objectdb level lock/block each other
| Type: Bug Reoprt | Version: 2.7.5_02 | Priority: Normal | Status: Active | Replies: 54 |
#1
hgzwicker
#2
hgzwicker
we how have compiled with the 02 version and the situation is like attached
#3
support
The two thread dumps show two different waiting situations. The first thread dump shows a page cache lock (0x00000000b6681e10) by one thread. The second thread dump (0x00000000bc88c318) is related to reading from the database file using the new "objectdb.temp.concurrent-file-read" option.
In both cases it is not a deadlock but a very short lock that is not expected to cause issues.
The change in ObjectDB version doesn't look related, it may be simply the exact timing in which each thread dump was taken.
If you can produce several more thread dumps (in production if possible) we may be able to identify the real issue.
ObjectDB Support
#4
hgzwicker
attached a series of 5 thread dumps
#5
hgzwicker
one more sequence (system not more performing)
#6
hgzwicker
we increased the cores to 24, RAM to 96 GByte. the behaviour still the same
we are really with our back at the wall, the customer now urges to switch to another database. we try to agree on a bit more time, but the situation is really hot
#7
support
We are analysing the thread dumps now and will get back to you soon.
ObjectDB Support
#8
hgzwicker
just a bit more parameters
- the database size is around 60 GByte (you have a copy of the database, a bit smaller but more or less what we have here)
- the database and all the file system is on an ultra fast SD drive
- we did do a Doctor repair, not any error shown
- ojectdb.conf is (we tried max-threads with 24, 40, 80, more or less the same result with any of these settings):
<!-- ObjectDB Configuration -->

<objectdb>

    <general>
        <temp path="$temp" threshold="256mb" />
        <network inactivity-timeout="0" />
        <url-history size="50" user="true" password="true" />
        <log path="$objectdb/log/" max="8mb" stdout="false" stderr="false" />
        <log-archive path="$objectdb/log/archive/" retain="90" />
        <logger name="*" level="info" />
    </general>

    <database>
        <size initial="256kb" resize="256kb" page="2kb" />
        <recovery enabled="true" sync="false" path="." max="96mb" />
        <recording enabled="false" sync="false" path="." mode="write" />
        <locking version-check="true" />
        <processing cache="4096mb" max-threads="80" />
        <index-update enabled="true" priority="40" />
        <query-cache results="1024mb" programs="500" />
        <extensions drop="temp,tmp" />
    </database>

    <entities>
        <enhancement agent="false" reflection="warning" />
        <cache ref="weak" level2="8096mb" />
        <fetch hollow="true" />
        <persist serialization="false" />
        <cascade-persist always="auto" on-persist="false" on-commit="true" />
        <dirty-tracking arrays="true" />
    </entities>

    <schema>
    </schema>

    <!--
    <server>
        <connection port="6136" max="100" />
        <data path="$objectdb/db" />
        <embedded-server enabled="true" />
        <replication url="objectdb://localhost/test.odb;user=admin;password=admin" />
    </server>
    -->

    <users>
        <user username="admin" password="admin">
            <dir path="/" permissions="access,modify,create,delete" />
        </user>
        <user username="$default" password="$$$###">
            <dir path="/$user/" permissions="access,modify,create,delete">
                <quota directories="5" files="20" disk-space="5mb" />
            </dir>
        </user>
        <user username="user1" password="user1" />
    </users>

    <ssl enabled="false">
        <server-keystore path="$objectdb/ssl/server-kstore" password="pwd" />
        <client-truststore path="$objectdb/ssl/client-tstore" password="pwd" />
    </ssl>

</objectdb>
#9
support
The thread dumps show various threads in waiting status in several different locations. None of them seems to be critical. In each location improvements are probably possible but first we have to locate the real bottleneck.
Could you please provide information regarding CPU and SSD usage? Is the situation now worse than a few weeks ago? Anything that was changed recently (including usage volume)?
ObjectDB Support
#10
hgzwicker
- CPU Usage (24 cores) at 80% average
- SSD, around 100 GByte free space, no significant/bad latency or queue
- customer IT did check all the system key indicators, nothing critical
- the situation is much more critical, today we switched back to 2.7.5, but the same behaviour
- nothing changed in the system configuration
#11
support
Maybe you are reaching the limit with the CPU usage? If you have 80% usage in average it is probably higher on load (maybe reaching 100%?), and then in peak time the system is obviously overloaded?
ObjectDB uses less CPU than most DBMS but eventually in a very high load 100% cpu usage is possible (and actually it is a good sign because it indicates that there is no locking issue that prevents full usage of the available CPU).
Could you please provide details about the number and types of transactions per minute when the system is on load?
ObjectDB Support
#12
hgzwicker
The 80% are only in these escalation situations. When the system runs smoothly we at around 20% and around 50 threads. When we have the performance issue we are at 80% and around 200 threads
#13
support
According to the subject of this thread it happens every 1-2 days. Can you confirm that it happens when the system is on load? Does it happen in a specific time of the day? any other pattern? a specific query or transaction (e.g. a report)?
You wrote that you increased the cores to 24. How many cores did you have before? Did you have 80% cpu usage on peak before and after the change?
How many cores have been used for the thread dumps in #4 and #5 above?
ObjectDB Support
#14
hgzwicker
The dumps have been produced with 20 cores.
The problematic situation is not caused by any specific activity, we run more or less the same queries all day.
The 80% cpu usage are before and after adding 4 cores
#15
hgzwicker
We tried to figure out any pattern but we could not figure out anything.
As mentioned in other issues it happens from time to time that a query that normally takes a second does take minutes
#16
support
The first 5 thread dumps have been taken at 7:03.
The next 5 thread dumps have been taken at 7:54.
Did the system return to normal performance between 7:03 and 7:54? and after 7:54?
ObjectDB Support
#17
hgzwicker
no, we had to shut down at around 9:30, then we did increase RAM and cores
#18
support
Did the issue start at 7:03?
The first thread dump seems different from the others, with no threads waiting for other threads in ObjectDB. Actually the system is almost idle. Then each tread dump adds more and more active threads.
Maybe your system has a component that when a query doesn't return fast enough it tries running it again and again? This could also be a user or users that send more and more requests of exactly the same action in a row.
In that case, can you block repeating requests before hitting ObjectDB? You can probably identify that activity in your log files (or in ObjectDB log files if you enable logging queries).
If repeating queries are the cause then the solution may be:
- Filter repeating requests / queries.
- Try to optimise queries that are too slow (and a few seconds could also be considered by users as slow), e.g. by using additional indexes, to prevent the need for repeating requests.
ObjectDB Support
#19
support
It also makes sense to prevent repeating queries at the ObjectDB level. There is a query cache of course, but it is useful for getting query results quickly only after the execution of the query is completed. No attempt by ObjectDB to block the same query from executing concurrently. But for this to work on the ObjectDB side the query must be an exact duplicate (e.g. if there is a current time parameter it cannot work).
Anyway, it is unclear yet if repeating / duplicate requests and queries cause your extreme system load.
ObjectDB Support
#20
hgzwicker
we do not repeat queries unless we have a result. We just have a lot of workplaces that send the same query. But each client sends out a request and waits for the reply before sending a new request
#21
support
> But each client sends out a request and waits for the reply before sending a new request
Are you sure about that? If your clients use a web application they may refresh the page if the response is too slow (again and again, as most of us do), and then a small delay produces much more load that doesn't stop.
Anyway, the way forward may be optimising the queries, and if duplicate requests are possible, to block them.
We will continue to explore the thread dumps. Obviously there are places for improvement but according to the analysis so far the problem is not with the waiting threads and locks (each wait is apparently short) but with the heavy running threads, which run massive queries against the data rather than against the indexes.
ObjectDB Support
#22
support
Maybe setting query timeout could also help, at least to kill queries that no one is waiting for them anymore, e.g. after a user refresh the page.
ObjectDB Support
#23
hgzwicker
we already have a query timeout. All the client/server interaction is running through a webSocket connection that is save against sending before q reply is received. Each package that is sent has a reply.
nevertheless we will add additional protection against any sending before a reply is received.
as regards the queries and the indexes, all the queries are optimized to be executed under 5 seconds and we are monitoring this permanently. When the system is smooth, sometimes for days, there is not any query with an execution time above that
#24
support
Build 2.7.5_03 includes an attempt to improve concurrency by replacing two main synchronized blocks (which are dominating the thread dumps that you posted) with alternative lock free thread safe mechanisms.
It is unclear if this improvement alone could be sufficient. You are already using 80% of the maximum available CPU, so even if this improvement will take you to 90% or 95% it may not make a drastic difference (unless the 80% includes wasting a lot of time with blocked threads, as this may be reduced now).
Maybe together with the two suggestions of #18 above (filtering duplicate requests and optimising queries) this issue can be eliminated.
Please keep us informed and if the issue is not solved please post new thread dumps using the new build.
ObjectDB Support
#25
hgzwicker
thanks, we'll immediately implement that and feedback results. We already added additional protection against double queries
#26
hgzwicker
we have installed during weekend in the production system. The system behaves now different from before and it is permanently between 30 and 80% load. We have during normal operation a lot of peeks (up to 100% of cpu load) + we see in the thread dump a lot of these things that we did not see before:
"ODB-StoreHandler-6829" #6829 daemon prio=5 os_prio=0 tid=0x000000003a35c800 nid=0x27e8 waiting for monitor entry [0x000000007d76e000]
java.lang.Thread.State: BLOCKED (on object monitor)
at com.objectdb.o.PGC.p(PGC.java:256)
- waiting to lock <0x0000000081367f88> (a java.lang.Object)
at com.objectdb.o.SNP.u(SNP.java:438)
at com.objectdb.o.MST.ax(MST.java:514)
at com.objectdb.o.MST.at(MST.java:475)
at com.objectdb.o.MST.ZK(MST.java:446)
at com.objectdb.o.INR.a(INR.java:130)
at com.objectdb.o.REG.s(REG.java:928)
at com.objectdb.o.VAR.l(VAR.java:828)
at com.objectdb.o.XQI.Ze(XQI.java:73)
at com.objectdb.o.TQI.Ze(TQI.java:71)
at com.objectdb.o.MQI.Ze(MQI.java:147)
at com.objectdb.o.GQI.Zf(GQI.java:150)
at com.objectdb.o.PRG.h(PRG.java:698)
at com.objectdb.o.PRG.g(PRG.java:560)
at com.objectdb.o.QRM.ZI(QRM.java:287)
at com.objectdb.o.MST.ZI(MST.java:1003)
at com.objectdb.o.STC.h(STC.java:465)
at com.objectdb.o.SHN.I(SHN.java:490)
at com.objectdb.o.SHN.w(SHN.java:156)
at com.objectdb.o.HND.run(HND.java:134)
at java.lang.Thread.run(Unknown Source)
Locked ownable synchronizers:
- None
#27
hgzwicker
please have a look at that, the situation is getting pretty much uncomfortable
#28
support
This stack trace already appeared in the thread dumps of #4 and #5 above. After eliminating the first top 2 locks in build 2.7.5_03 this is probably now the new dominant lock.
You reach now 100% cpu usage in peaks but unfortunately (and as expected) it does not solve the main problem, which seems to be that some frequent queries require too much cpu. The stack traces show queries that scan data pages intensively. Hopefully there should be a way to make these queries run faster with less resources by using additional indexes or with other changes to your application.
We may try to eliminate this lock as well by switching to no-lock synchronization (this is more complicated than the previous two so it would take more time), but you already reach 100% cpu usage in peaks so this is probably not the solution. As suggested, you should consider optimising your application activity against the database.
ObjectDB Support
#29
hgzwicker
> The stack traces show queries that scan data pages intensively
can you write us the thread # that you mean. We did not change our application at all, we do not understand why this happens in an unchanged environment
#30
support
Almost all the stack traces that mention objectdb in the thread dumps that you posted show scanning database pages. When a query cannot be executed by using indexes then massive scan of database data pages is required. This may be appropriate for a batch report query running in the background but not for a frequent query against a large database that is used in interactive mode.
The stack trace from #26 above also shows scanning database pages. It is blocked waiting to access a database page. Different threads can use the same database page concurrently but there is currently a synchronized block that locks the page for a very short time before access is granted. We will try to eliminate this synchronization but the expectations that this alone will solve the load issue are low.
ObjectDB Support
#31
support
If you have other frequent stack traces in your new thread dumps they may help.
ObjectDB Support
#32
hgzwicker
is there a possibility (extra costs are no problem) that you have a look at 2-3 typical queries that we use (you have our database) and to give us an idea what additional index could help ?
#33
hgzwicker
here are some typical queries:
select o from ObjectNode o join o.properties p1 join o.linkedObjects c1 where o.classIdentifier = '(OP)' and (((c1.classIdentifier = '(TC)' and c1.objectNameUpper = 'CAM-MILLING' and c1.type = 1 and c1.state = 0) or (c1.classIdentifier = '(TC)' and c1.objectNameUpper = 'CAM-ELECTRODES' and c1.type = 1 and c1.state = 0)) and (o.linkedObjects.classIdentifier = '(US)' and o.linkedObjects.objectNameUpper = 'STRIEGEL.MARKUS' )) and (o.properties.name = 'roughPlanning' and o.properties.doubleValue = 1) and (p1.name = 'plannedState' and p1.doubleValue > 0)
select distinct o from ObjectNode o join o.properties p1 join o.properties p2 where (o.classIdentifier = "(OP)" and o.linkedObjects.classIdentifier = "(TC)" and (o.linkedObjects.objectNameUpper = "MILLING-EL" and o.linkedObjects.type = 1) and (o.properties.name = "feedbackState" and o.properties.doubleValue != 13) and (p1.name = "plannedState" and p1.doubleValue = 4)) and ((o.state = 4) or ((p2.name = "startableState" and p2.doubleValue = 0)))
select distinct o from ObjectNode o join o.properties p1 join o.linkedObjects c1 where o.classIdentifier = '(OP)' and o.parentNode.classIdentifier = '(PO)' and (o.linkedObjects.classIdentifier = '(TC)' and o.linkedObjects.objectNameUpper like 'CAM%' and o.linkedObjects.type = 1 and o.linkedObjects.state = 0) and (c1.classIdentifier = '(US)' and c1.objectNameUpper = 'NIECHZIOL.HEIKO') and (o.properties.name = 'feedbackState' and o.properties.doubleValue != 13) and (p1.name = 'plannedState' and p1.doubleValue > 0 )
select distinct o from ObjectNode o JOIN o.properties p2 JOIN o.properties p3 JOIN o.properties ps JOIN o.childNodes c where o.classIdentifier = '(OP)' and (o.linkedObjects.classIdentifier = '(TC)' and o.linkedObjects.objectNameUpper = 'MILLING-EL' and o.linkedObjects.type = 1 and o.linkedObjects.state = 0) and (o.properties.name = 'feedbackState' and o.properties.doubleValue < 13) and (p2.name = 'plannedState' and (p2.doubleValue > 0 and p2.doubleValue < 4)) and (p3.name = 'startableState' and p3.doubleValue = 1) and ((o.isNextOperations is not empty)or(o.isCurrentOperation is not empty))
#34
hgzwicker
the version 03 seems to have a memory leak, we had to shut down now the complete system on 60 GByte RAM used. Again, we did not change anything on our side, there was no memory leak till that version
#35
support
Running these queries on the database that you sent in a previous issue (a 48 GB database) shows that indexes are actually used, but unfortunately not in the most effective way. The file contains almost 5 million ObjectNode instances and you have indexes with more than 200,000 database pages. Therefore it is critical to make sure that index lookup rather then full index scan will be used in order to avoid scanning hundreds of thousands of pages on every query execution, as currently happens.
The good news is that apparently there is a huge room for improvement. The bad news is that this could be tricky and consume considerable time. It may also require changing the object model in order to get optimal results.
We provide basic client specific support through our private priority support, which costs 2,400 GBP per year. As many of the issues that you had in the past required a quick response (and you couldn't usually wait the 2-3 days average response time in our free public support) you probably need priority support anyway. If optimising your object model and queries will require more than the advising that we can provide through our private priority support we may have to consider additional steps including a site visit.
ObjectDB Support
#36
hgzwicker
we have no problem to go for the priority support, please let send us an invoice for that. How can we go on with the improvements ?
#37
support
> the version 03 seems to have a memory leak
Sorry to hear. The changes in build 03 were quite minor and were reviewed and tested carefully but it is possible of course that something was missed. More information (e.g. a heap dump or information about the objects in the leak) may help.
ObjectDB Support
#38
hgzwicker
+ please have a look at the memory consumption
#39
hgzwicker
it was not more possible to create a heap dump, we even had to restart the complete server (after shutdown of our system it was not even possible to open the database with the explorer)
#40
hgzwicker
I would prefer to go for a 2 step solution whete a first fast step would not need a change of the data model
#41
support
> it was not more possible to create a heap dump
Are you using build 03 now? does it perform better? If you do please take a heap dump when RAM usage is increased but before it is too late.
> I would prefer to go for a 2 step solution whete a first fast step would not need a change of the data model
Yes, that makes sense.
We will send you an invoice for one year priority support tomorrow. Please create a new private support ticket for the optimisation process and provide as much useful information as possible, including overview of the object model, list of all the frequent queries (or an explanation how queries are built and what components they may include), details about activity (number of concurrent users, queries by type per minute, new objects and updates by type per minute), etc. a link for downloading the up to date 60GB database could also help.
ObjectDB Support
#42
hgzwicker
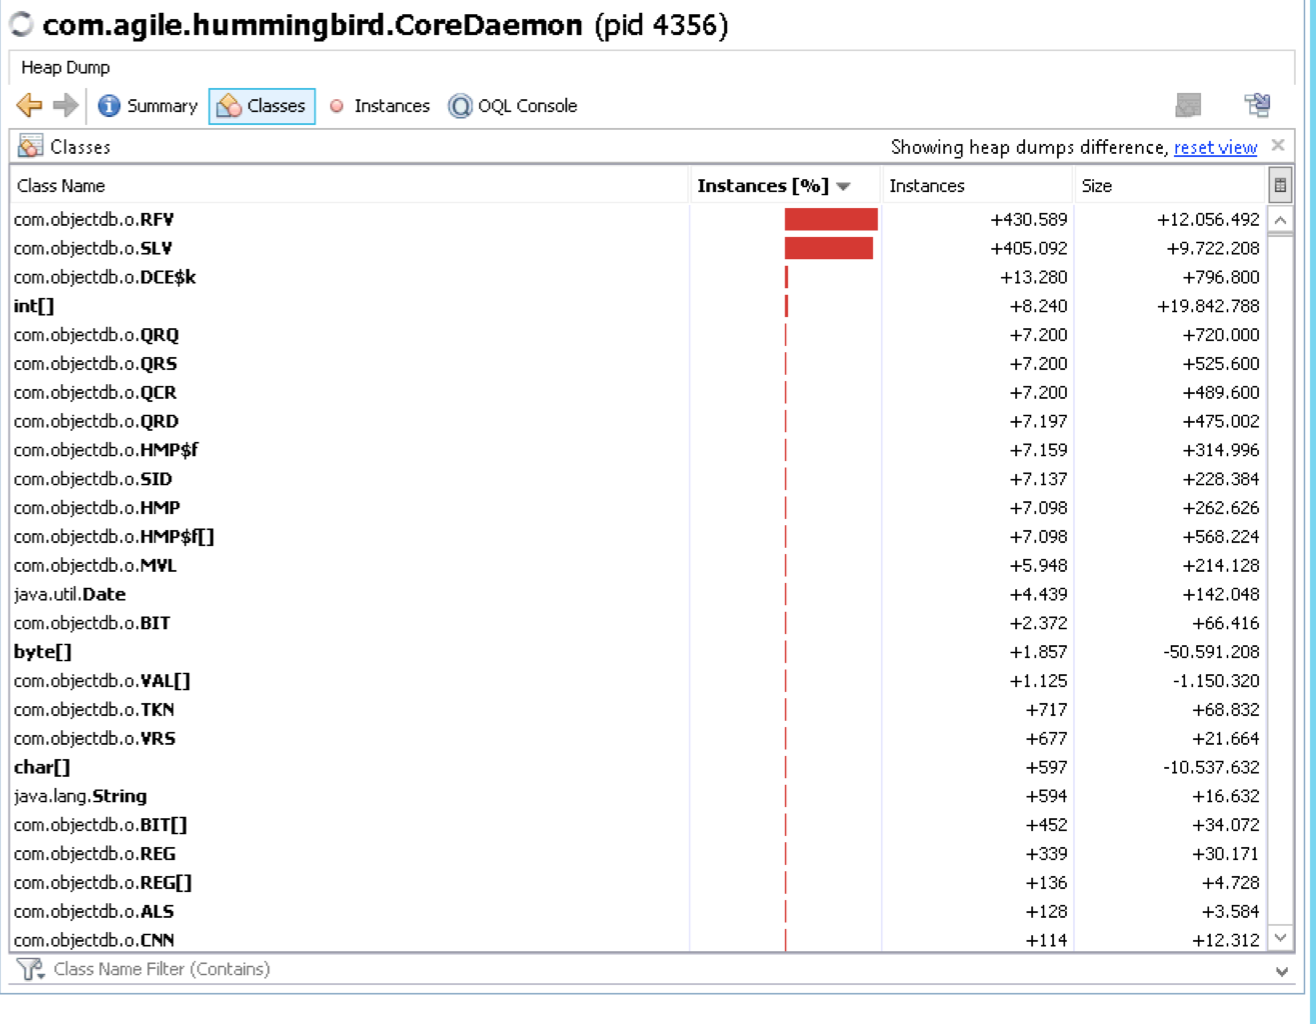
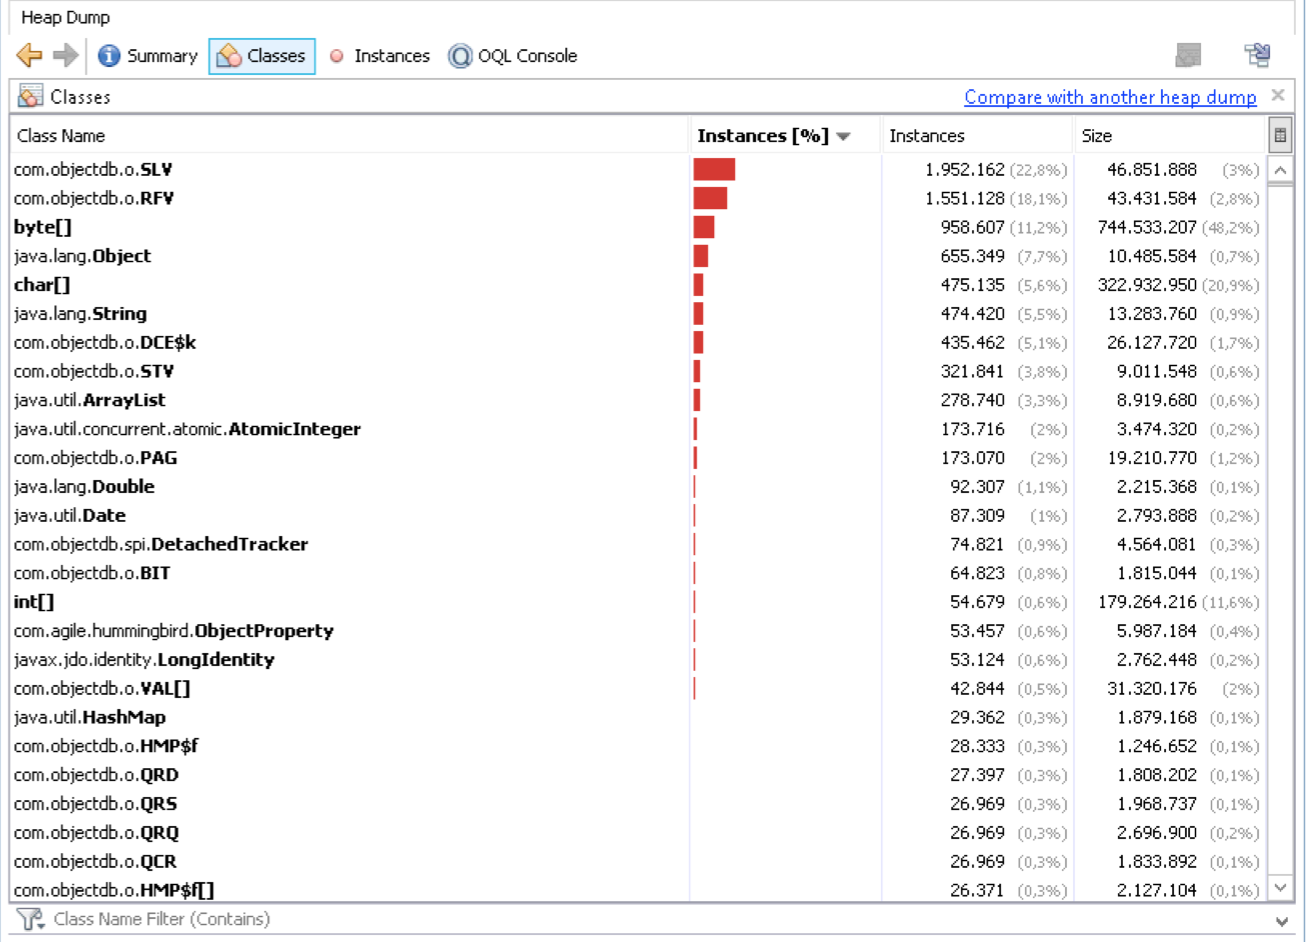
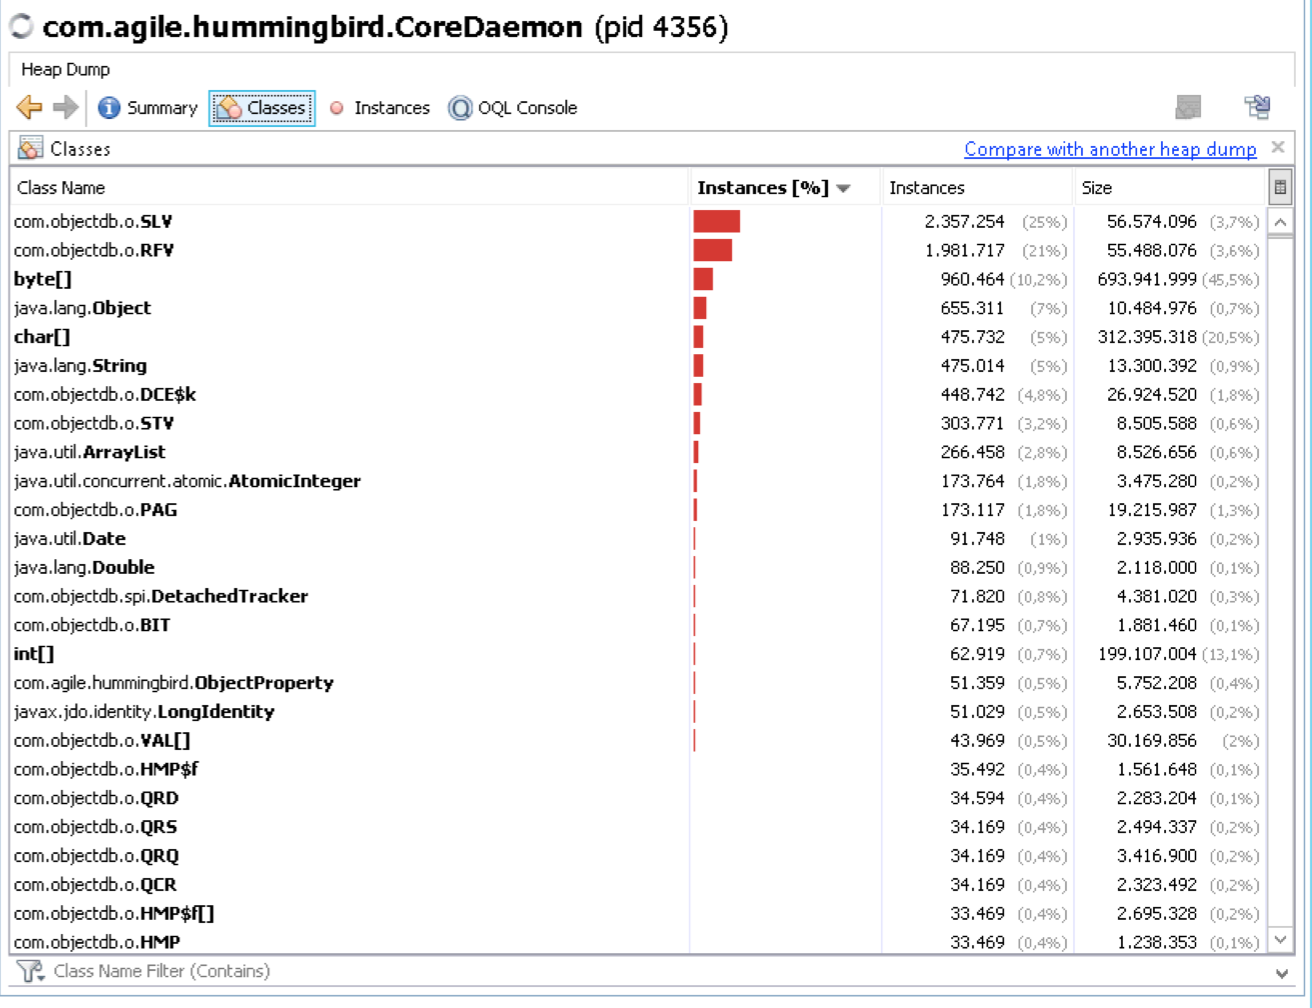
attached heap dumps after restart (for sure now there not much traffic)
1, first
2, second
1-2, difference between 1 and 2
#43
hgzwicker
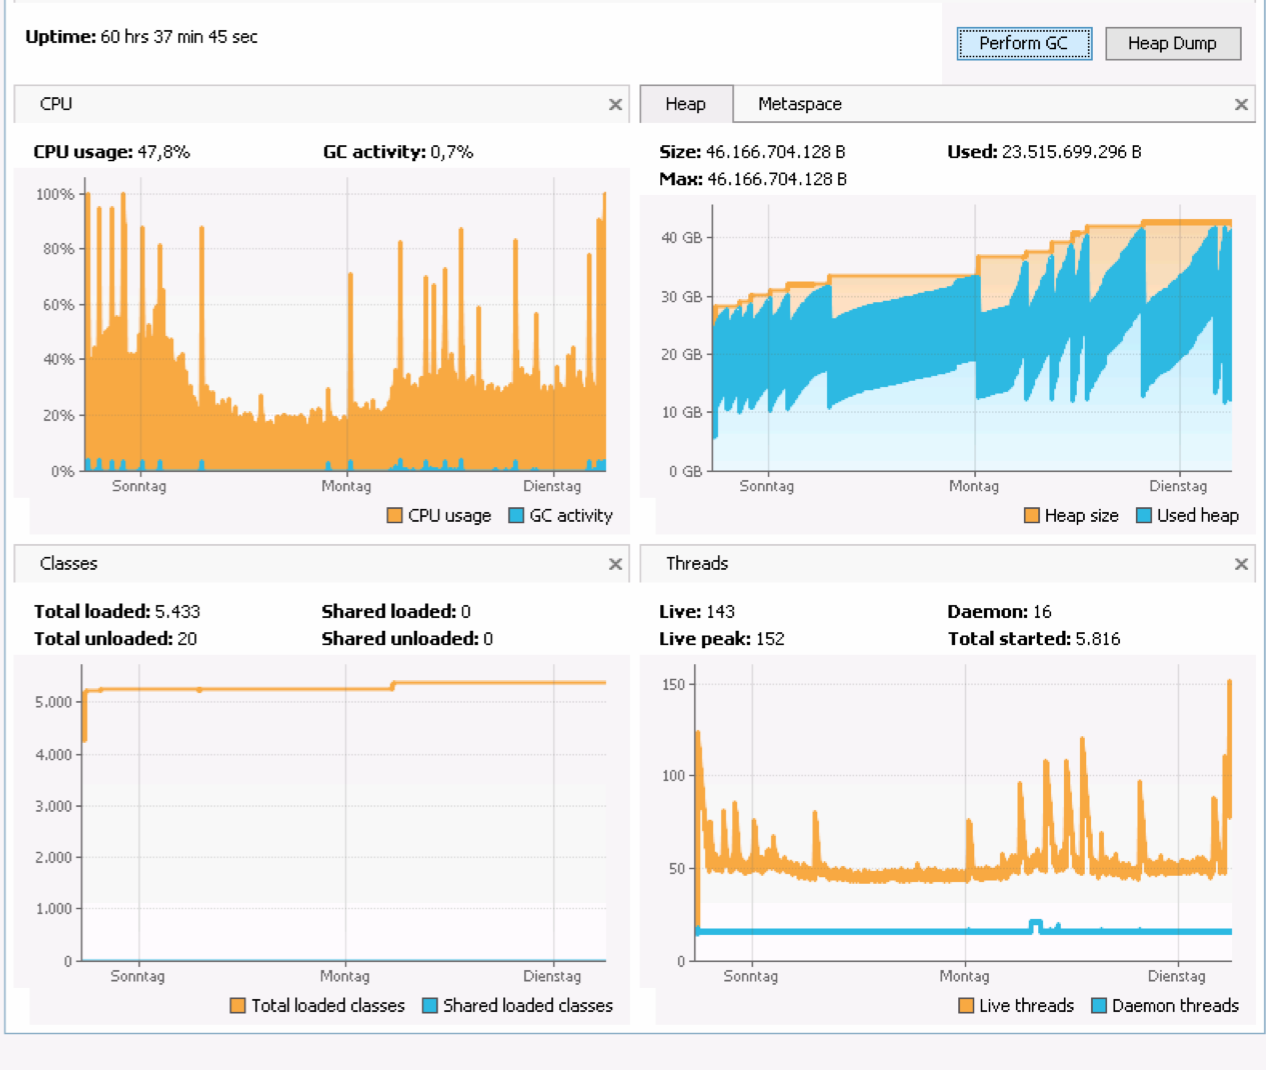
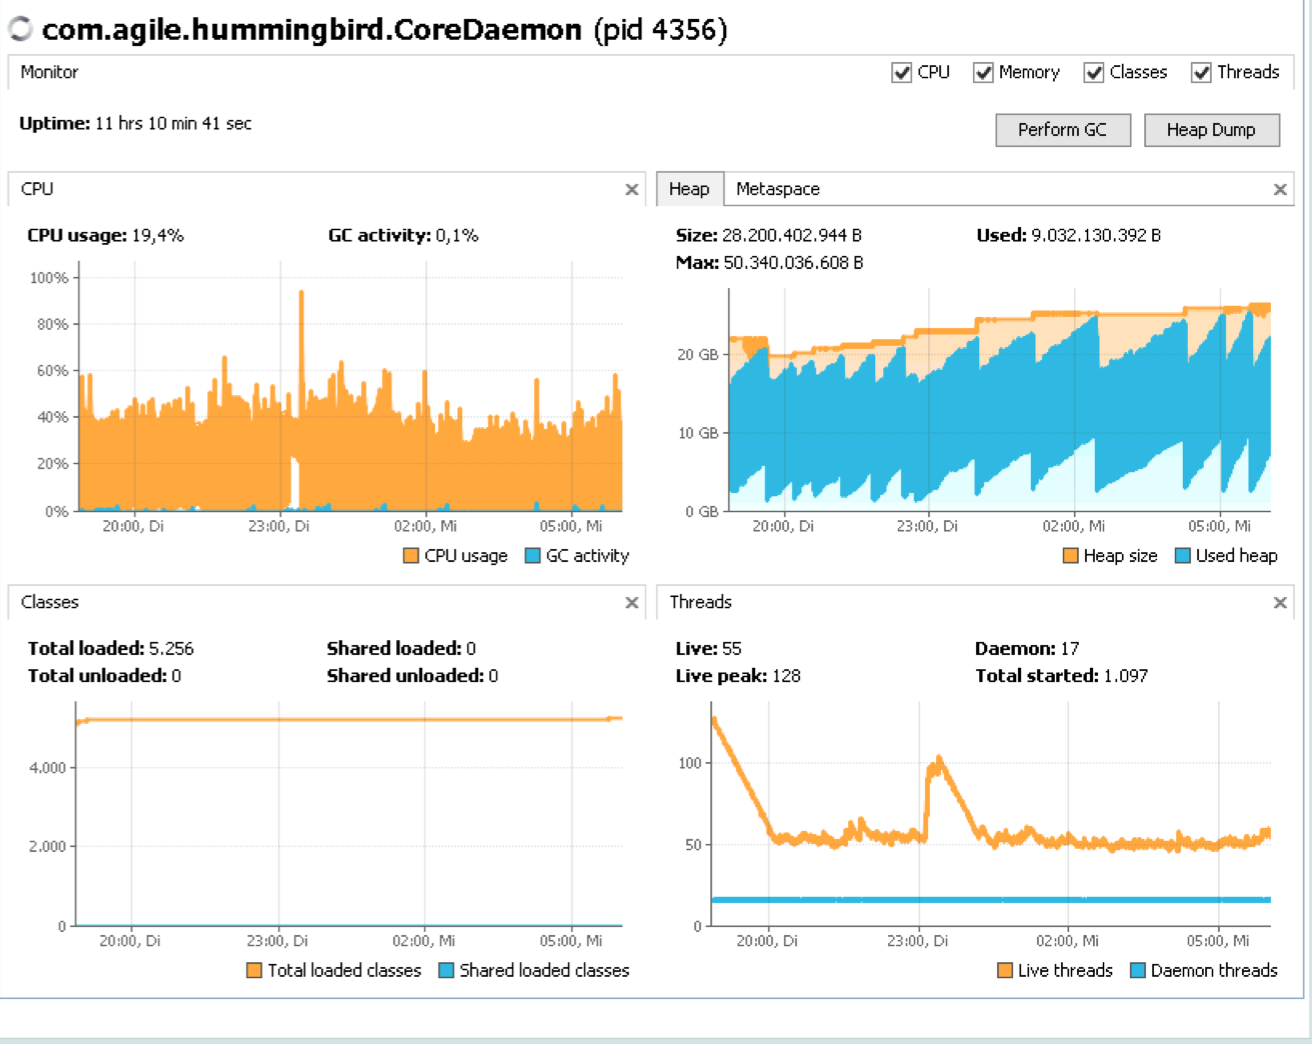
As you can see from the attached monitoring, there is a different behaviour between saturday (restart of our core system including version 2.7.5_03 together with adding some more indexes, indexing on startup, you can see the escalation towards yesterday evening) and the startup yesterday. The peek at around 23:00 is because of an automated database backup, not critical.
between saturday and yesterday we had always CPU peeks on GC what we do not have since startup yesterday evening.
also the lower memory consumption is much higher from saturday compared to yesterday startup
may be the reindexing on startup has a problem?
we just added simple indexes:
- Action.created
- Action duration
- Action.descriptiontText
- Action.detail
- ObjectNode.created
- ObjectNode.internalReference
- ObjectNode.currentLocation
- ObjectNode.precessors
#44
support
Regarding #42, the heap dumps do not show a memory leak. The objects that are added to the heap are related to: (1) the L2 cache, (2) the query caches, and that is normal when cache is built up. They shouldn't be related to any change in build 03.
Regarding #43, maybe the suspected memory leak is related to the new index building rather than to the changes in build 03 (which are very minor and controlled)?
> between saturday and yesterday we had always CPU peeks on GC what we do not have since startup yesterday evening.
Maybe the activity is lower just because it was evening / night and not peak hours?
> may be the reindexing on startup has a problem?
Adding new indexes to a large database may consume considerable resources (much more than a backup) and should be done when system load is low. There are no known issues with re-indexing but everything is possible.
ObjectDB Support
#45
hgzwicker
it seems that the memory consumption is now stable after restarting. So the issue seems to be related to the index adding (what was during a low load situation saturday night)
#46
hgzwicker
the system is no again near to the collaps.
- a permanent CPU load of 50-60% (which was before version 2.7.5_03 at around 20%)
- average # threads at around 120 (which was before version 2.7.5_03 at around 55)
#47
support
Please take a thread dump if possible.
If build 2.7.5_02 (or earlier) works better you may want to switch back.
ObjectDB Support
#48
hgzwicker
attached the dump
#49
support
The only change in build 2.7.5_03 is moving from lock based synchronization to lock free synchronization. It should enable more threads to work concurrently with no blocking. But sometimes blocking threads and reducing the number of concurrent threads works better.
How do you know that the system is near to collapse? Slow response time?
ObjectDB Support
#50
hgzwicker
we monitor queries that need more than 5 seconds. Normally there is not any one, now we have each 5-10 seconds one
#51
support
Do you monitor this by query type? Can you see the queries that take more than 5-10 seconds?
ObjectDB Support
#52
hgzwicker
attached our trace file, you can see the queries and durations in each entry
#53
hgzwicker
you can ignore the lock/lock forced messages, this is normal (internal)
#54
support
If there are too many concurrent running threads now after eliminating locks in build 2.7.5_03 then reducing the number of processing threads in the ObjectDB configuration could help.
You may try 40 (maybe even 20 or 15) instead of 80:
<processing cache="4096mb" max-threads="40" />
Or switch back to build 2.7.5_02.
But again, the fundamental issue is probably too many heavy queries per second and that will be discussed in the private support ticket.
ObjectDB Support
#55
hgzwicker
we already changed before the restart yesterday to 48