ObjectDB ObjectDB

Best practise loading big data

#1

Hello,

currently we take some effort to improve the overall performance of our product. ObjectDB is the main data provider within our solution. In the past we often discovered performance problems when it came to transactions with lots of entities.

We have a scenario in which we need efficient data access on a large 2 dimansional table. Internally we used a list entities which hold a list of table rows which is a list of embeddable entities holding the final (String) value together with just a boolean flag.


@Entity
class MyStepBlockCollection {
  @OneToMany (cascase=ALL, fetch=Lazy, target=MyStepBlock}
  ArrayList<StepBlock> stepBlocks;
}


@Entity
class MyStepBlock {
  @OneToMany (cascase=ALL, fetch=Lazy, target=MyStep}
  ArrayList<StepBlock> steps;
}


@Entity {
class MyStep {
  @ElementCollection (fetch=LAZY)
  ArrayList<MyValue> values;
}


@Embeddable
class MyValue {
  @Basic
  boolean flag;
  @Basic
  String stringValue;
}

The number of MyStep elements can reach over a million, the number of MyValue objects within a MyStep instance can reach 10.000.

We have some prominent scenarios to access these values. Creating and traversing. For the traversing we access the data block by block - in each block step by step and in each step value by value.

When do this within one transaction without holding a reference on the retrived entities then we discover that the memory consumption is extremly high, many elements are hold by internal classes of ObjectDB. Garbage collection does not gain enough free memory.

We experimented a bit but so far only workarounds helped to gain a lower memory footprint. One is to stupidly commit the transaction after a certain number of read accesses (every 10000 read access to commit and open a new transaction). But this does not sound like a nice solution. We tried to detach the MyValue object before returning them but we could not see some performance improvement or less memory consumption by doing that, too.

We would kindly ask you to give us some hints or advice how to access the data or how to configure the DB to get the most performance possible.


With kind regards,

Rainer Lochmann, BTC EmbeddedSystems AG

edit
delete
#2

Some clarifications are needed:

  1. ArrayList<StepBlock> is mentioned twice in your code but StepBlock is not defined. Could you please repair the code?
  2. You mentioned commit as a workaround. It is unclear if this operation includes updates to the database or it is read only. If it is a read only operation, do you really need commit? maybe you can use rollback or clear instead of commit?
  3. Do you always use only enhanced classes? With enhanced classes ObjectDB is not expected to hold strong references (which prevents garbage collection) to non dirty entity objects.
  4. Can you share a heap dump of your application during this operation or at least useful information about the number of instances in the heap per type and paths of strong references from roots to objects?
ObjectDB Support
edit
delete
#3

@Entity
class MyStepBlockCollection {
  @OneToMany (cascase=ALL, fetch=Lazy, target=MyStepBlock}
  ArrayList<StepBlock> stepBlocks;
}


@Entity
class MyStepBlock {
  @OneToMany (cascase=ALL, fetch=Lazy, target=MyStep}
  ArrayList<MyStep> steps;
}


@Entity {
class MyStep {
  @ElementCollection (fetch=LAZY)
  ArrayList<MyValue> values;
}


@Embeddable
class MyValue {
  @Basic
  boolean flag;
  @Basic
  String stringValue;
}
edit
delete
#4

Hello,

  1. sorry for posting questionable code snippets. I have repaired it.
  2. In this scenario the data is only read so we do not need to commit - commit is a NOOP. If it is faster to rollback or just to clear then we can do that instead. Thanks for this hint!
  3. Yes, only enhanced classes are used in this example. We know that for real performance measurement and memory consumption we always have to use enhancement and that a mixture of enhanced and not enhanced classes is not recommended.
  4. Takes a bit to create. I will add the data soon.
edit
delete
#5

Commit is almost no-op in that case so don't expect performance improvements with rollback / clear, although it makes more sense to use them and maybe there will be some gain.

As said above ObjectDB should not hold your unused entity objects with strong references, so hopefully the heap dump could help in understanding the issue.

ObjectDB Support
edit
delete
#6

The current reading scenario is scetched here:

Open DB connection to existing DB with one persisted MyStepBlockCollection. This contains of 10.000 MyStepBlock objects. Each of these containing 100 MyStep objects. Every MyStep contains a list of 2 MyValue objects.

Then we do something like this

MyStepBlockCollection sbc = entityManager.find(id);
for (MyStepBlock sb : sbc.stepBlocks) {
    for (MyStep s : sb.steps) {
        MyValue v : s.values.get(0);
    }
}

The values are not referenced by our implementation after retrieving them. All MyStepBlocks and all MyStep and half of the MyValue objects have been loaded during the loop. I had a break point right after the loop. At this point we had an open DB connection with an open transaction but no referenced objects from outside the DB.

Then I ran the garbage collector and took a memory snapshot. I would have expected that most of the memory would have been freed. But we end up in consuming about 178 MB of memory still reachable by strong references.

I will add some snapshots from the profiler.

edit
delete
#7
edit
delete
#8

We have scenarios in which we open up to lots of different Db files at the same time, each with own entitiy manager and open transaction holding a MyStepBlockCollection with read access. If all of them potentially hold this amount of memory then our application gets into trouble. So we need a solution for this serious issue.

We would like to know if

  • - we do something wrong and should change the accessing methods or
  • - if the analysis is right how can we make sure that memory is freed (without splitting the reading transaction into arbitrary chunks) or
  • - if ObjectDB should be improved to handle this case properly

Kind regards,

Rainer Lochmann

edit
delete
#9

Posts #7 and #8 above are related to issue #2087 and should be discussed on that thread. The heap dump in #7 shows only a single entity instance, which is maintained as a delegate for the type (and built using the no-arg constructor), one per open database / entity type, as explained in that thread.

Let's separate the discussion:

  • Use issue #2087 to discuss using a large number of concurrent open databases.
  • Use this thread if loading big data consumes memory space that is not released by ObjectDB in one database. In that case please provide a heap dump that shows entity objects that have been read in the loop (and not the single delegate object as shown on #7 above).
ObjectDB Support
edit
delete
#10

I have added another snapshot of a dump after calling GC at the end of the reading loop. Indeed nearly no of the read entities are left in memory. I had opened two vectors so I got two instances of each of our entity classes.

So if we do not reference the entities, GC can collect them.

But it looks like there is some infrastructure (cache releated classes? ) that was built up during reading and now when all references from outside were gone - they remain in memory. There is this 117 MB of memory that is somehow locked. Closing the entitiy manager should free the memory - but freeing no longer objects should be better done inside the DB if possible.

edit
delete
#11

ObjectDB manages several cache data structures:

You may use the above links to the see default sizes of caches and how to configure them.

Please clarify whether the RAM is released when you close the database (i.e. the EntityManagerFactory).

If you need an advice regarding tuning cache sizes to reduce RAM please provide more information about the RAM consumption of relevant ObjectDB objects in the heap dump.

ObjectDB Support
edit
delete
#12

Hello, we use these settings:

  • Page Cache <processing cache="256mb" max-threads="10" />
  • Query Cache: <query-cache results="32mb" programs="500" />
  • Entity Chaches: <cache ref="weak" level2="0" />

So level 2 cache is deactivated. References in level 1 cache is weak and we can observe that unreferenced entities can be freed from the garbage colltecter.

Our problem is that the infrastructure (looks like a map of WeakReference objects) grows and grows within this transaction, even if at some time the GC collects the unused entities. When reading further, the cache size and the number of weak references still grows. One could expect that the could be reused if their referenced objects are freed or that from time to time. the cache is cleaned up. Our scenario uses just one open transaction. Objects are read so there they are still referenced by weak refernces. GC can collect them but within this long transaction it seems that the cache grows unlimited until the transaction ends.

When we close the transaction then the memory is freed and everything is fine again. What us bothers is that currently we have no other chance then to cut transitions or flush or clear or close from outside the DB to circumvent this problem of memory loss. But therefor we need to implement some heuristics to guess when to commit or to clear or whatever is needed to get through this scenario. But we do not know what the best strategy is. Currently we help a ourself by doing some auto-commit/rollback/flush/reconnect strategy but it would be definitely better to have such strategies within ObjectDB.

Surely we can provide more details. Please have a look at the latest screenshot. Here some internal objects can be seen. Please let me know what details you need to know and how I can help.

Kind regards,

Rainer Lochmann

edit
delete
#13

> Page Cache <processing cache="256mb" max-threads="10" />
> Query Cache: <query-cache results="32mb" programs="500" />

You may want to consider reducing the page cache size from 256mb to much smaller (e.g. 16mb). Note that if there is free memory available then the OS will cache the database file pages. So the effect of reducing the page cache size is automatically reduced by the OS. The page and query caches do not use weak references and therefore may use the allocated space for unlimited time. The OS cache, however (outside ObjectDB) will cache file pages only when RAM is available.

> Our problem is that the infrastructure (looks like a map of WeakReference objects) grows and grows within this transaction, even if at some time the GC collects the unused entities. 

This may be normal as the GC doesn't release objects as soon as they become unreachable by strong references. If they are released when the GC is invoked that this delay should not concern.

If reducing the cache size in the ObjectDB configuration, as suggested above, doesn't help then please consider submitting a full heap dump that we can explore, as the screenshots provide very limited information.

ObjectDB Support
edit
delete
#14

Hello, thank you for your fast response. I have tried out with the proposed setting of

<processing cache="16mb" max-threads="10" />

Now the behavior is different. 

Here is my debug scenario:

I have an existing DB File that contains

  • One single root MyStepBlockCollection object. This referenced
  • 10.000 MyStepBlocks, each of them references 100 MyStepObjects, so:
  • 1.000.000 MyStepObjects, each step holding 2 MyValue instances
  • 2.000.000 MyValue objects

I open the DB connection, create an entitiy manager and start to read the first half of the MyValue objects in nested for loops as sketched in post #6. For the next half I would to write something like MyValue v : s.values.get(1);

So I suspended my test program directly behind the nested reading loop construct. As before, no references to loaded entities is hold by our application.

I forced the GC to collect garbage. With the new setting it looks like now the entities are still in memory. This was different to when I used the old setting with 256mb.

My heap dump is nearly 700MB of size. The file size limit seems to be 8MB. How can I send it to you?

Kind regards


edit
delete
#15

PS: the real classes in our application are named with prefix "DBVector" instead of "My" as written in the pseudo code snippets. For classes we use the suffix "Impl". MyValue corresponds to SignalValue which is the base class of IntegerSignalValueImpl and FixedPointSignalValueImpl.


edit
delete
#16

Added a snapshot from EclipseMemoryAnalyzer.

edit
delete
#17

Did you use enhanced classes in your test? You should always use enhanced classes. If not, running the same test with enhanced classes may consume much less memory.

ObjectDB Support
edit
delete
#18

Indeed, I accidentally touched two of the entity classes so I had a mix of attached and detached classes. Sorry for that.

So I repeated the test run after enhancing all classes.

First observation:

With not enhanced classes the tool needs less than 2 minutes to read a million values - now as before with different cache settings and enhanced classes it takes more than 8 minutes. This I would have not expected - normally enhancement speeds up the application. At start of reading, the DB can deliver about 1000 values within 150ms and at the end before reaching the million the last 1000 values need about 9 seconds to be read.

Again memory consumption increases over run-time when GC does not interfere. Then after 1.000.000 million read values GC is called manually - all entities are freed, but we still have a lot of weak reference objects and com.objectdb.o.ENT and com.objectdb.o.SLV and WeakReferences that remain in memory.

The new cache setting makes no detectable difference on application side.

The heap dump now is about 270 MB. How can I provide it?

edit
delete
#19

> With not enhanced classes the tool needs less than 2 minutes to read a million values - now as before with different cache settings and enhanced classes it takes more than 8 minutes. This I would have not expected - normally enhancement speeds up the application.

As you wrote, using enhanced classes usually improves performance. However, when enhanced classes are used ObjectDB can use lazy loading (for relationships that are not annotated as eager) in situations in which it is impossible to use lazy loading if the classes are enhanced. Eager / lazy setting can increase or decrease performance depending on the specific application. If this is the case then you should be able to improve performance with enhanced classes by eager / lazy setting.

There may be other reasons. If you could post a simple basic test case that demonstrates a performance issue we may be able to explore it further.

You can upload the heap dump to the internet (e.g. to Dropbox) and share the link.

ObjectDB Support
edit
delete
#20

Before uploading the heap dump:

  • Double check that you changed the cache sizes in the correct configuration file. Please read this documentation page regarding the location of the configuration file. You may try using a non valid configuration file with an error - if there is no error message by ObjectDB then this is not the configuration file that is actually  used by ObjectDB. In recent releases of ObjectDB you can the path to the actually used configuration file in the log.
  • Please make sure that the heap dump is taken after garbage collection. Unreachable objects that are kept in memory by the JVM until garbage collection should not concern.
ObjectDB Support
edit
delete
#21

I have rechecked: I changed the XML node <database> to <database-error>. Then I started the test and got:

!ENTRY com.btc.ep.base.dal 4 0 2018-05-23 22:49:57.892 !MESSAGE [com.btc.ep.base.dal.internal.repositories.OdbPersistenceManagerImpl(207)] The activateService method has thrown an exception !STACK 0 java.lang.NoClassDefFoundError: Could not initialize class com.objectdb.o.RCL at com.objectdb.o.UNM$f.(UNM.java:167) at com.objectdb.o.UNM.r(UNM.java:107) at com.objectdb.o.UNM.q(UNM.java:77) at com.objectdb.jpa.Provider.createEntityManagerFactory(Provider.java:58) at com.btc.ep.objectdb.services.ObjectDBProviderFactory.createEntityManagerFactory(ObjectDBProviderFactory.java:25) at com.btc.ep.base.dal.internal.repositories.OdbPersistenceManagerImpl.createEntityManagerFactoryIfNotExistent(OdbPersistenceManagerImpl.java:709) at com.btc.ep.base.dal.internal.repositories.OdbPersistenceManagerImpl._optimizeNewProfilePerformance(OdbPersistenceManagerImpl.java:177) at com.btc.ep.base.dal.internal.repositories.OdbPersistenceManagerImpl.activateService(OdbPersistenceManagerImpl.java:168)
...


edit
delete
#22

We have created an account for you on our ftp server.

Server: ftp.btc-es.de
User: objectdb
PW: ht815$M4

I will upload the heap dump soon - with triggered GC.

Kind regards, Rainer

edit
delete
#23

Heap dump is online. As described before:

- using a configuration with the attached configuration (double checked)
- one open transaction
- reading out the first million values
- GC invocation
- heap dump

Kind regards, Rainer


edit
delete
#24

Thank you for the heap dump.

For every managed object ObjectDB has to maintain additional information in an ENT instance. Every ENT instance contains a weak reference to an actual entity object. When the actual entity object becomes unreachable the weak reference is nullified and the ENT object becomes invalid. However, it is still strongly referenced by ObjectDB and not released immediately as shown in this heap dump. ObjectDB releases obsolete ENT objects when new ENT objects are created. Releasing ENT objects lazily is more efficient in most cases, but following you report we should reconsider it.

However, the more important question is probably why ENT objects are not released during the reading (rather than when reading is completed), as this is the way it usually works with lazy clearing of ENT objects: When new ENT instances are created they replace the old obsolete instances.

One possible cause is holding strong references to all the old entity objects that have been read so far (up to 1,000,000) but is it correct that you only keep strong references to a small number of entity objects during reading?

Another possible cause is that during reading entity objects are not released, even so they are not strongly reachable, simply because the garbage collection never releases them or not run at all. This seems to be uncommon for retrieval of 1,000,000 objects but maybe could happen with some heap size and GC setting. Can you check if GC is run during the retrieval? If you add an explicit invocation of GC in the retrieval loop, does it help?


ObjectDB Support
edit
delete
#25

Getting back now after looking at the heap dump to your code in #6 above:

MyStepBlockCollection sbc = entityManager.find(id);
for (MyStepBlock sb : sbc.stepBlocks) {
    for (MyStep s : sb.steps) {
        MyValue v : s.values.get(0);
    }
}

Does a single MyStepBlockCollection contain up to 1,000,000 values?

In that case at the end of the loop there is a point in which your application has strong references to 1,000,000 entity objects, so releasing ENT objects by ObjectDB up to that point is impossible anyway.

You should probably avoid holding the entire tree of objects in memory and we can discuss various ways to iterate these values in a more memory friendly way.

ObjectDB Support
edit
delete
#26

Hello, thank you for your answer. Yes the MyStepBlockCollection would contain all entities in the DB if the lists all hold references to the entities. The algorithm just holds the root element at the end. All other objects have been visited during iterating the for loops but are no longer referenced directly outside the root entity.

I just wonder why the GC can collect all entities. Or I cannot find them.

I would like to start the discussion for an alternative iteration. What do you propose?

PS: To create a small example outside our application might take a bit. Do you still think we need that for further discussion?

edit
delete
#27

Hello, I managed to create a small example:


import java.io.File;
import java.util.ArrayList;

import javax.persistence.Basic;
import javax.persistence.CascadeType;
import javax.persistence.ElementCollection;
import javax.persistence.Embeddable;
import javax.persistence.Entity;
import javax.persistence.EntityManager;
import javax.persistence.EntityManagerFactory;
import javax.persistence.FetchType;
import javax.persistence.Id;
import javax.persistence.OneToMany;
import javax.persistence.Persistence;

import org.junit.Test;

/**
 * This class ....
 *
 * @author me
 */
public class ObjectDB2302Issue {

    @Entity
    static class MyStepBlockCollection {

        @Id
        public long Id = 1;

        @OneToMany (cascade = CascadeType.ALL, targetEntity = MyStepBlock.class, fetch = FetchType.LAZY)
        ArrayList stepBlocks = new ArrayList<>();
    }

    @Entity
    static class MyStepBlock {

        @OneToMany (cascade = CascadeType.ALL, targetEntity = MyStep.class, fetch = FetchType.LAZY)
        ArrayList steps = new ArrayList<>();
    }

    @Entity
    static class MyStep {

        @ElementCollection (fetch = FetchType.LAZY)
        ArrayList values = new ArrayList<>();
    }

    @Embeddable
    static class MyValue {

        @Basic
        public boolean flag;
        @Basic
        public String stringValue;
    }

    @Test
    public void rawTest() {

        System.setProperty("objectdb.conf", "C:\\Users\\developer\\Desktop\\objectdb.conf");

        String fileName = "E:\\test.odb";
        File f = new File(fileName);
        if (f.exists()) {
            f.delete();
        }

        EntityManagerFactory emf = Persistence.createEntityManagerFactory("E:\\test.odb");
        EntityManager em = emf.createEntityManager();

        // create values
        em.getTransaction().begin();
        MyStepBlockCollection sbc = new MyStepBlockCollection();
        sbc.Id = 1;
        em.persist(sbc);

        for (int iStepBlock = 0; iStepBlock < 10000; iStepBlock++) {
            MyStepBlock stepBlock = new MyStepBlock();
            sbc.stepBlocks.add(stepBlock);

            for (int iStep = 0; iStep < 100; iStep++) {
                MyStep step = new MyStep();
                stepBlock.steps.add(step);

                MyValue val = new MyValue();
                val.flag = false;
                val.stringValue = "4711";
                step.values.add(val);

                val = new MyValue();
                val.flag = true;
                val.stringValue = "Green";
                step.values.add(val);
            }

        }
        em.getTransaction().commit();

        sbc = null;

        long counter = 0;
        em.getTransaction().begin();
        sbc = em.find(MyStepBlockCollection.class, 1);
        for (MyStepBlock sb : sbc.stepBlocks) {
            for (MyStep s : sb.steps) {
                MyValue v0 = s.values.get(0);
                MyValue v1 = s.values.get(1);
                counter += 2;
            }
        }
        System.out.println("Read value = " + counter);
        sbc = null;
        em.getTransaction().commit();
        em.close();
        emf.close();
    }

}


edit
delete
#28

Observations on a test run with profiler (and on enhanced classes).

  • Break point after writing loop with commit and directly before the statement sbc = null;
    All entities are in RAM (Capture1). Additional memory used for WeakReferences, SLV and ENT objects.
  • Break point directly behind the statement sbc = null;
    Now the test method does not hold any references. The transaction is commited. After triggering GC the profiler shows that we still have a million weak references, a million SLV and a million ENT objects claiming about 100 MB of RAM together.
  • Break point after reading before second statement sbc = null;
    All entities are in RAM.
  • Break point after reading after second statement sbc = null;
    No references are hold by the test application any more. None of the entities have been altered but GC can not free any of the entities nor any of the internally references objects of ObjectDB (Capture4)
  • Break point after commit(). GC can not gain free memory though the transaction has been commited.
  • Break point after closing the entity manager.
    Still all the memory is used (Capture 5).
  • Break point after closing the entitiy manager factory.
    Still all memory in use. Entities have detached trackers (Capture 6).
  • After leaving the test method GC can now collect the free memory and throw away all the objects.
edit
delete
#29

Meanwhile we produced a similar test program, which demonstrates the issue and possible solutions:

import java.util.*;

import javax.jdo.*;
import javax.persistence.*;

public class F2302 {

    public static void main(String[] args) {
        
        EntityManagerFactory emf =
            Persistence.createEntityManagerFactory("F2302.odb");
        EntityManager em = emf.createEntityManager();

        //populateDatabase(em);
        
        
        scanDatabase(em);

        em.close();
        emf.close();
    }

    private static void populateDatabase(EntityManager em) {
        int valueCount = 0; 
        em.getTransaction().begin();
        StepBlockCollection blockCollection = new StepBlockCollection();
        blockCollection.stepBlocks = new ArrayList();
        for (int i = 0; i < 100; i++)
        {
            StepBlock stepBlock = new StepBlock();
            blockCollection.stepBlocks.add(stepBlock);
            stepBlock.steps = new ArrayList();
            for (int j = 0; j < 100; j++)
            {
                Step step = new Step();
                stepBlock.steps.add(step);
                step.values = new ArrayList();
                for (int k = 0; k < 100; k++)
                {
                    Value value = new Value();
                    value.data = new byte[128];
                    step.values.add(value);
                    valueCount++; 
                }
            }
        }
        em.persist(blockCollection);
        em.getTransaction().commit();
        System.out.println(valueCount + " values persisted.");
    }

    private static void scanDatabase(EntityManager em) {
        long startTime = System.currentTimeMillis();
        int valueCount = 0; 
        StepBlockCollection collection =
             em.find(StepBlockCollection.class, 1);

//        // Original code: Holds the entire tree in memory:              
//        for (StepBlock sb : collection.stepBlocks) {
//            for (Step s : sb.steps) {
//                valueCount += s.values.size();
//            }
//        }
        
//        // Solution #1: remove (with not commit) step blocks after reading:
//        Iterator<StepBlock> itr = collection.stepBlocks.iterator();
//        while (itr.hasNext()) {
//            StepBlock sb = itr.next();
//            for (Step s : sb.steps) {
//                valueCount += s.values.size();
//            }
//            itr.remove();
//        }

//        // Solution #2: Use a temporary queue and free the root collection:
//        Queue<StepBlock> queue = new LinkedList(collection.stepBlocks);
//        collection = null; 
//        while (!queue.isEmpty())
//        {
//            StepBlock sb = queue.poll();
//            for (Step s : sb.steps) {
//                valueCount += s.values.size();
//            }
//        }
//
        // Solution #3: Use JDO's evict:
        PersistenceManager pm = em.unwrap(PersistenceManager.class);
        for (StepBlock sb : collection.stepBlocks) {
            for (Step s : sb.steps) {
                valueCount += s.values.size();
            }
            pm.evict(sb);
        }
        
        long elapsedTime = System.currentTimeMillis() - startTime;
        System.gc();
        Runtime runtime = Runtime.getRuntime();
        System.out.println(valueCount + " values read in " +
            elapsedTime + "ms, heap size: " +
            (runtime.totalMemory() - runtime.freeMemory()));

        // Uncomment to stop before exit for taking a heap dump:
        //try {
        //    System.out.println("Press any key to exit.");
        //    System.in.read();
        //}
        //catch (java.io.IOException x) {
        //}
    }

    @Entity public static class StepBlockCollection {
        @Id int id = 1;
        @OneToMany(cascade=CascadeType.ALL)
        List<StepBlock> stepBlocks;
    }

    @Entity public static class StepBlock {
        @OneToMany(cascade=CascadeType.ALL)
        List<Step> steps;
    }

    @Entity public static class Step {
        List<Value> values;
    }

    @Embeddable
    public static class Value {
        byte[] data;
    }
}

Providing a minimal test program in this format in future cases (as also described in the posting instructions) may help accelerating handling them.

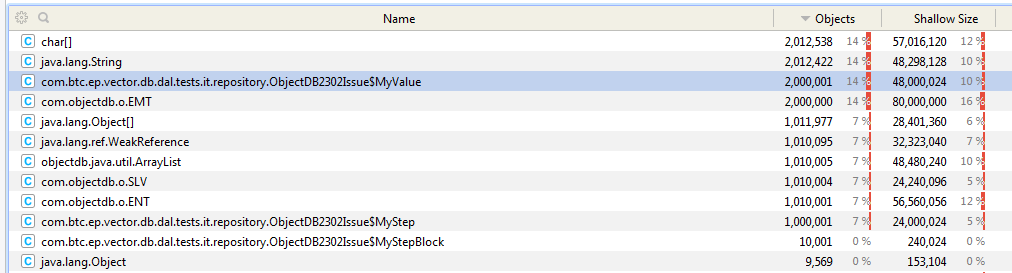
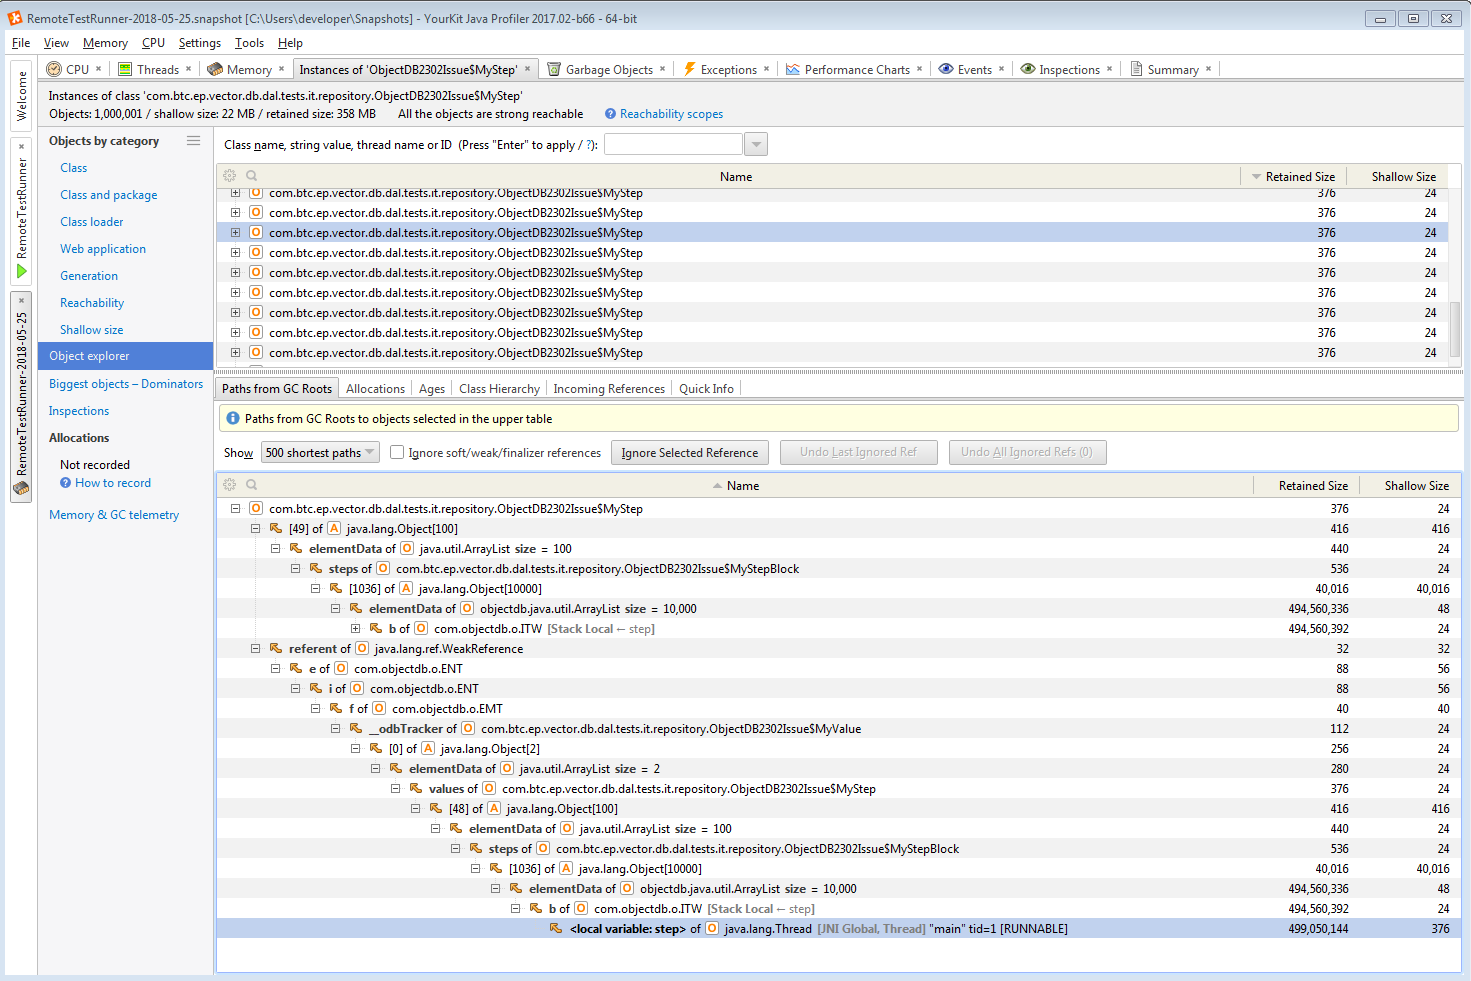
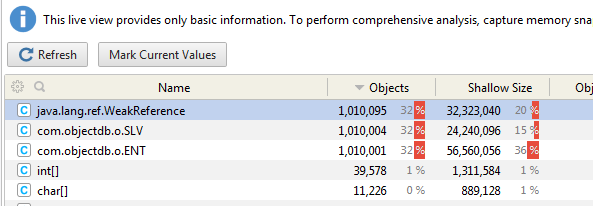
The problematic loop that preserves strong references to all the entity objects:

    for (StepBlock sb : collection.stepBlocks) {
        for (Step s : sb.steps) {
            valueCount += s.values.size();
        }
    }

Output:

1000000 values read in 1733ms, heap size: 239995944

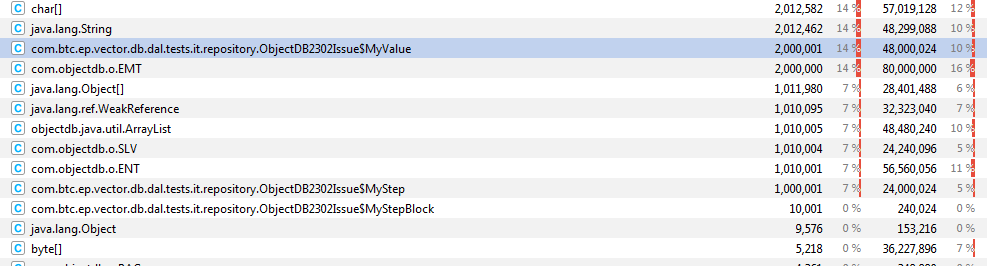
In solution 1 step blocks are removed from the parent collection after processing:

    Iterator<StepBlock> itr = collection.stepBlocks.iterator();
    while (itr.hasNext()) {
        StepBlock sb = itr.next();
        for (Step s : sb.steps) {
            valueCount += s.values.size();
        }
        itr.remove();
    }

Output:

1000000 values read in 1275ms, heap size: 25624704

Although it works well, you have to be very careful not to include this code in an active transaction and then commit because the database content will be changes in that case.

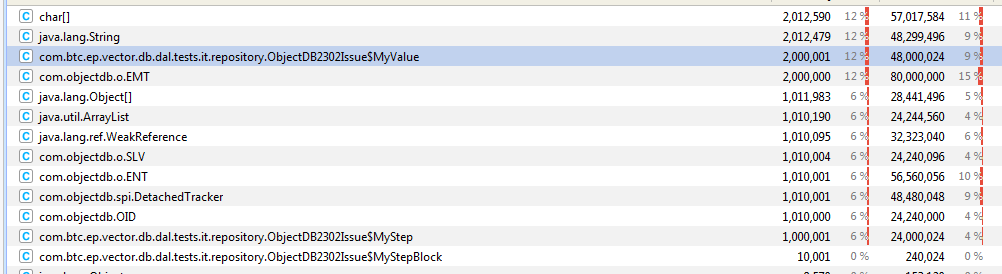
Solution 2 moves the step blocks for processing to a separate queue and then discards the root collection entity:

    Queue<StepBlock> queue = new LinkedList(collection.stepBlocks);
    collection = null; 
    while (!queue.isEmpty())
    {
        StepBlock sb = queue.poll();
        for (Step s : sb.steps) {
            valueCount += s.values.size();
        }
    }

Output:

1000000 values read in 1285ms, heap size: 30928312

Solution 3 is more elegant. It uses the evict operation on processed objects to return them to hollow state (as they where before accessing and loading their content from the database):

    PersistenceManager pm = em.unwrap(PersistenceManager.class);
    for (StepBlock sb : collection.stepBlocks) {
        for (Step s : sb.steps) {
            valueCount += s.values.size();
        }
        pm.evict(sb);
    }

Output:

1000000 values read in 1207ms, heap size: 25166920

Since the evict operation is not supported by JPA we have to cast the JPA EntityManager instance to JDO's PersistenceManager, which works like JPA EntityManager but with some additional operations.

Processing cache size on these runs was 16MB and datra cache was disabled.


ObjectDB Support
edit
delete
#30

To avoid a situation in which you have one million week references etc. (as shown in #28 above), you should avoid holding one million entity objects in memory if this is not essential, and in post #29 you can see different ways to do that.

ObjectDB Support
edit
delete
#31

Hello, thank your for your kind advice. I have tried it out. Therefor I had to change the test program as attached.

I let it run twice - with and without using evict(). Both times on enhanced entities.

Run without:

phase: Start Test - heap size: 2365544
phase: 1 - heap size: 2991128
phase: 2 - heap size: 315066672
phase: 3 - heap size: 157969240
phase: 4 - heap size: 491840792
phase: 5 - heap size: 491840792
phase: 6 - heap size: 539329104
phase: 7 - heap size: 535220600
phase: 8 - heap size: 499077616
phase: End Test - heap size: 4446424

Run with evict()

phase: Start Test - heap size: 2355760
phase: 1 - heap size: 2984648
phase: 2 - heap size: 315135792
phase: 3 - heap size: 158038360
phase: 4 - heap size: 159331608
phase: 5 - heap size: 159331608
phase: 6 - heap size: 160099912
phase: 7 - heap size: 160097992
phase: 8 - heap size: 123957144
phase: End Test - heap size: 5338840

The run with using evict looks better regarding its memory consumption.

edit
delete
#32

But still: our profiler claims about claimed memory after nulling hard references to the root entity, after commit and even after closing the entitiy manager and after closing the entitiy manager factory. Can you reproduce this effect?

The objects are again WeakReference and from internal ObjectDB classes. Is there something that I can do or does objectdb need to clean up internally?

edit
delete
#33

Your new test case includes also writing to the database. For further discussion about memory usage when writing to the database please create a new thread, as this is about "Best practise loading big data".

Interestingly using a for each loop causes holding the entire tree of objects reachable in memory:

    for (MyStepBlock sb : sbc.stepBlocks) {

Java creates a local Iterator variable for the each loop that keeps a strong reference to the collection, and the managed collection holds a strong references to the root object (to report updates if any). This local variable (the for each iterator) is released in this test case at the end of the main method.

After moving this for each iteration to a separate method and duplicating the call to gc (sometimes it takes more than one invocation of gc to release memory) the results (with evict) are:

hase: Start Test - heap size: 4206776
phase: 1 - heap size: 4785400
phase: 2 - heap size: 332543992
phase: 3 - heap size: 173972808
phase: 4 - heap size: 175726192
phase: 5 - heap size: 175725136
phase: 6 - heap size: 62605024
phase: 7 - heap size: 62606440
phase: 8 - heap size: 23209952
phase: End Test - heap size: 19094352

Some other ideas:

  • If you are using 64 bit JVM you should consider switching to 32 bit JVM, even on 64 bit OS, when applicable (less than 4GB is needed), as it can save a lot of memory.
  • For large trees it may be essential to micro optimise space. For example in your last test case large amount of memory is used by ArrayList instances with 2 items because of the default constructor of ArrayList that prepares for 10 items.
ObjectDB Support
edit
delete
#34

Same test on JDK 1.8.0_171 32 bit (with ArrayList initial size 2):

phase: Start Test - heap size: 2430328
phase: 1 - heap size: 2526992
phase: 2 - heap size: 139657912
phase: 3 - heap size: 137698512
phase: 4 - heap size: 139672840
phase: 5 - heap size: 137835000
phase: 6 - heap size: 69912960
phase: 7 - heap size: 55219760
phase: 8 - heap size: 3005616
phase: End Test - heap size: 2969376
ObjectDB Support
edit
delete
#35

Hello, the test program has just a part to generate the data it reads out later. So writing is just a preparation for the test. We do not need another issue for that.

Your hint regarding the iterator is very helpful to understand how the entities are referenced. I wonder a bit why Java holds the invisible iterator after its usage. So I rewrote the loops and iterated via int index instead. And yes the run now looks much better. Without using evict() now we have

phase: Start Test - heap size: 2355392
phase: 1 - heap size: 2983568
phase: 2 - heap size: 315075080
phase: 3 - heap size: 157977648
phase: 4 - heap size: 492215256
phase: 5 - heap size: 159295160
phase: 6 - heap size: 56702632
phase: 7 - heap size: 50131312
phase: 8 - heap size: 5581376
phase: End Test - heap size: 5581376


edit
delete
#36

But still ...

Now I have a code that reads out data without holding references. In the code at a breakpoint at printMem("4"); all entities are no longer referenced and there is no implicit Iterator to hold unnecessary references. I have used evict() though it is not JPA.

Before the commit of the transaction and forcing GC a couple of times our profiler still shows 100MB of used memory by one million weak references, com.objectdb.o.SLV and com.objectdb.o.

After the commit (at printMem("5")) there are still in memory. After the clear() command (at printMem("6")), GC can remove the memory.

So what is the best strategy for us. Should we always clear() after commit() ? clear() seem to take some seconds in this example. The amount of claimed memory here is 100 MB but just because we just read 1 million values. On real examples we might have 10 billion values. Then I would expect that much more memory is claimed before GC starts to clean up.

Shouldn´t there be an internal limit and an automatic internal clean up task within ObjectDB ?

Unfortunately using 32 bit Java JVM is not an option for us. We sometimes need more than 2GB of RAM.

Kind regards.

edit
delete
#37

Calls to evict release the strong references to the entity objects in your tree but the objects are still managed by ObjectDB and until the garbage collection removes the entity objects a large number of ENT and WeakReference instances are already created and hold by ObjectDB. Then they are released lazily as explained in #24 above.

Use JPA's detach (or JDO's makeTransient) to remove the management of entity objects by ObjectDB (and the ENT and WeakReference instances):

       for (int i = 0; i < sbc.stepBlocks.size(); i++) {
            MyStepBlock sb = sbc.stepBlocks.get(i);
            for (int j = 0; j < sb.steps.size(); j++) {
                MyStep s = sb.steps.get(j);
                MyValue v0 = s.values.get(0);
                MyValue v1 = s.values.get(1);
                counter += 2;
                em.detach(s);
            }
            em.detach(sb);
        }

The output in that case is:

phase: Start Test - heap size: 3900384
phase: 1 - heap size: 4559936
phase: 2 - heap size: 316131664
phase: 3 - heap size: 60625968
phase: 4 - heap size: 59440480
phase: 5 - heap size: 56861384
phase: 6 - heap size: 57598928
phase: 7 - heap size: 54734336
phase: 8 - heap size: 16748760
phase: End Test - heap size: 18214496

This should work well in read only transactions (or outside transaction) but be careful not to merge the tree back to ObjectDB and commit a transaction as all detached objects will be treated as new (unknown) objects by ObjectDB.

ObjectDB Support
edit
delete
#38

For the read scenario we have learned a lot from this case. For write or rw-mixed scenarios I think as you pointed out a good solution would look different.

What we could need is some option to somehow influence the mechanism of lazy object releases. As you mentioned in #24 you also think about reconsidering this. What it be possible to get a prototype with some new option to force cleanup of unused ENT and WeakReference objects by some heuristics (number of object, time, memory limit) ?

Kind regards,

Rainer Lochmann

edit
delete
#39

We will check the option for quicker release of weak references, etc.

You wrote:

> Unfortunately using 32 bit Java JVM is not an option for us. We sometimes need more than 2GB of RAM.

Have you considered using a 64 bit JVM with Zero-Based Compressed Ordinary Object Pointers (oops)?


ObjectDB Support
edit
delete
#40

Hello, no the article was very interesting but is definitely no direction in which we want to spend efforts. Our product is a mix of components (Java 1.6, Java 1.8, OSGi-plugins , loaded-DLLs - 32 and 64 bit, executables, Matlab Scripts, external libraries) that runs on a variety of user machines (different bit sizes, Windows 7, Windows 10, different time zones). Just to run all unit and system tests would cost more than a week to run.

Therefore we do not change any basic parameters of the JVM. The solution should take place either in our code or in yours or in both.

Can you please give an answer to post #38 ?

Regards, Rainer

edit
delete
#41

Regarding using Zero-Based Compressed Ordinary Object Pointers (oops), it is just a JVM parameter (tested by Oracle and many other users, although tests by you are also needed), so even if it is not appropriate to work on it now, you may want to consider it in the future as an option, as it can save a lot of RAM.

We will work on an ObjectDB option for release of weak references earlier. However, note that they cannot be released before the relevant entity objects are released, and objects are not released by the Garbage Collector immediately. Therefore, during a long reading loop (as demonstrated by your test case) you may not see any improvement (and using evict / detach may give better results). It may only help in releasing weak references automatically after a massive reading operation ends.

ObjectDB Support
edit
delete
#42

Following your request a new configuration option was added in build 2.7.5_01:

        <cache ref="weak" purge="true" level2="0" />

You can enable automatic background purge of weak references and associated objects by setting purge="true" (the default is false).

Feedback will be welcomed.

ObjectDB Support
edit
delete
#43

Hello,

we tested the new objectdb version with and without the parameter 'purge'.

But in both cases we get the following exception in one of our important use case:

Caused by: java.lang.NullPointerException: null
    at com.objectdb.o.OBM.aO(OBM.java:414) ~[na:na]
    at com.objectdb.o.OBM.aO(OBM.java:270) ~[na:na]
    at com.objectdb.o.EMR.c(EMR.java:193) ~[na:na]
    at com.objectdb.o.TVS.b(TVS.java:105) ~[na:na]
    at com.objectdb.o.TVS.b(TVS.java:94) ~[na:na]
    at com.objectdb.o.EMR.g(EMR.java:78) ~[na:na]
    at com.objectdb.jpa.EMImpl.merge(EMImpl.java:496) ~[na:na]
    ... 26 common frames omitted

With ObjectDB version 2.7.5 it runs fine, we don't get the exception.

Do you know what is the reason?

best regards

BTC

edit
delete
#44

This may be a side effect, although the exact cause is unknown.

Build 2.7.5_02 includes an attempt to avoid this exception.


ObjectDB Support
edit
delete
#45

Thank you for the fixed version.

Now our important use case runs correctly.

edit
delete
#46

Good. Please report the result of using the new purge setting, when results are available.

ObjectDB Support
edit
delete

Reply

To post on this website please sign in.