Step 5: Design a BIRT Report Chart
In this step we will add a simple chart to the report:
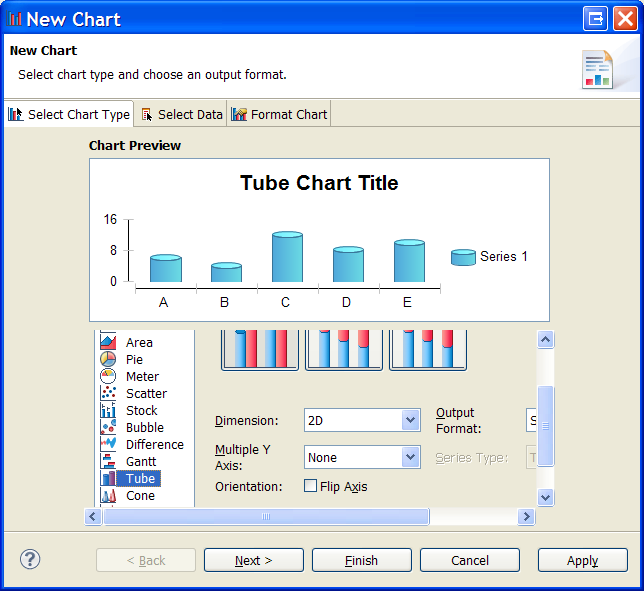
- Open the [New Chart] dialog box by dragging a Chart from the [Palette] window and dropping it on the report design (.rptdesign) layout.
- In the [Select Chart Type] tab select Tube as the chart type and click Next.
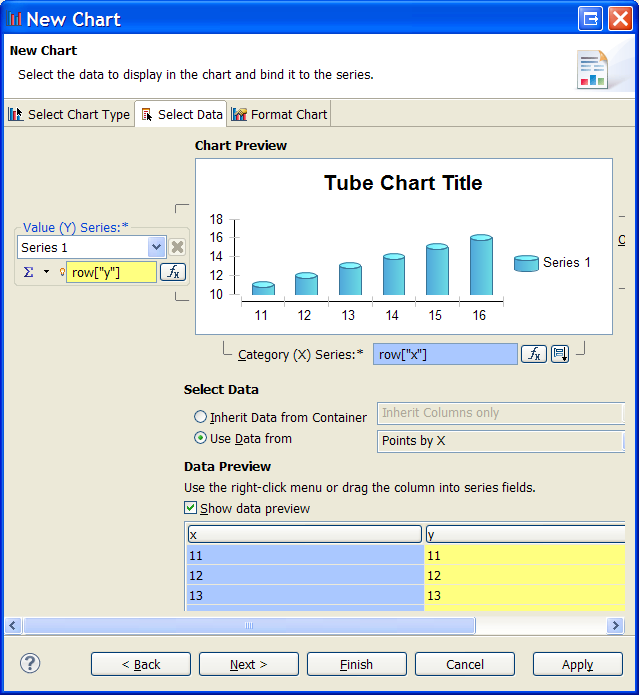
- In the [Select Data] tab - enter row["y"] as the Y series and row["x"] as the X series, (use Ctrl + Space in these fields for content assistant) and click Next.
- In the [Format Chart] tab you can set the chart title, background, etc.:
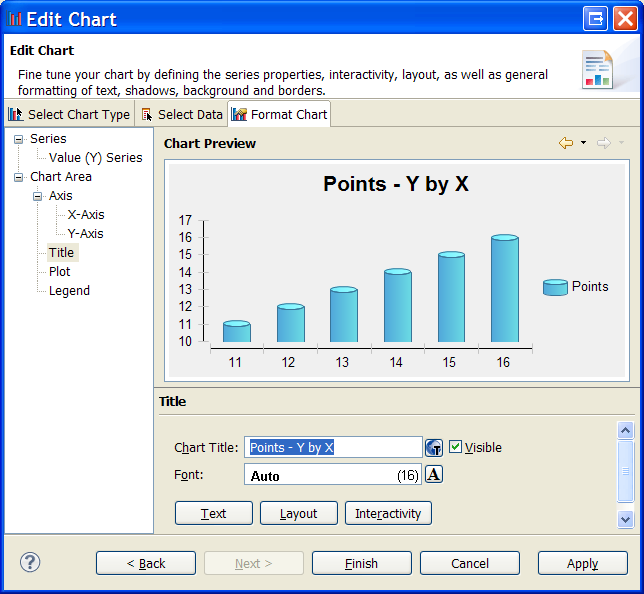
- Click Finish to add the chart to the report page:
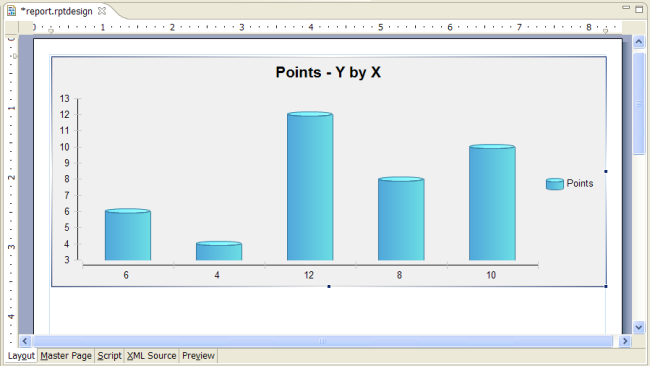
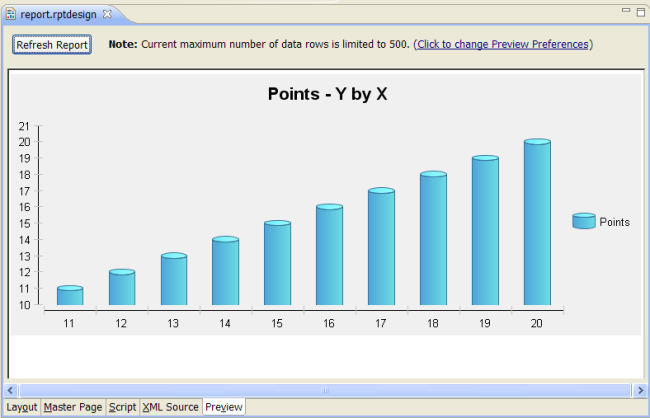
- You may click Preview now to see the chart with the real data:
In the next step we will add a table view of the same data to the report.