Step 6: Design a BIRT Report Table
In this final step we will add a simple table to the report:
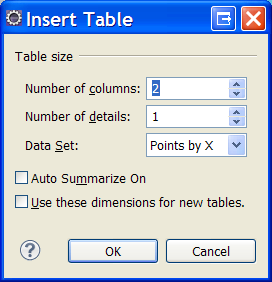
- Open the [Insert Table] dialog box by dragging a Table from the [Palette] window and dropping it on the report design (.rptdesign) layout.
- Set the column number to 2, number of details to 1, select the data set (e.g. Points by X) in the third field and click OK.
- Fill the table with data by dragging the x and y columns from the data set in the [Data Explorer] window (under the data set node) and dropping them on the second table row (the first row, which represents the table header will be filled automatically):
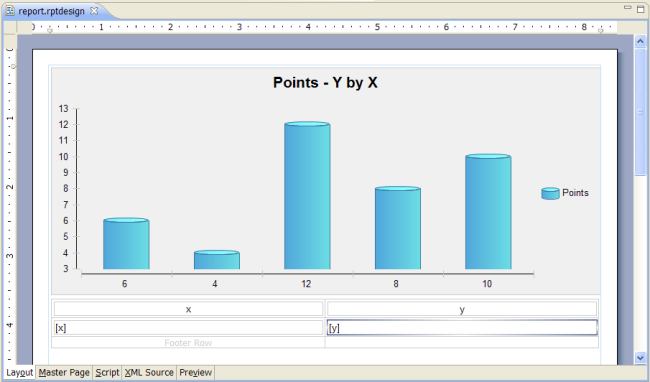
- Use the properties table to complete the table design (e.g. change the background color).
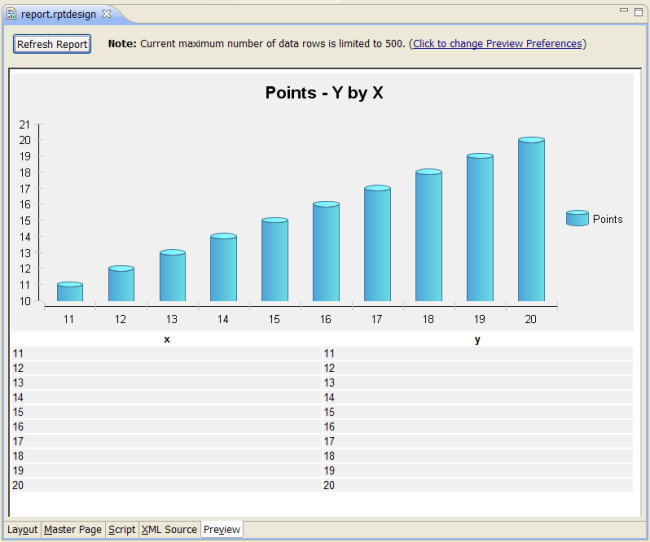
- You may click Preview now to see the table with the real data:
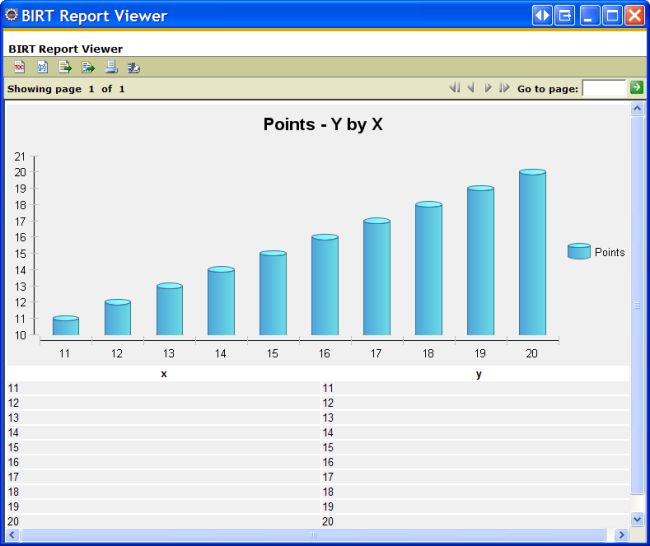
- You can run the report by right clicking the report node in the [Navigator] window and selecting Report > Run Report: